present
Daftar dan dapatkan potongan bernilai $50 untuk pembelian pertama anda
Trading product for MidasVolumeProfile Indikator Key Levels Volume, image 1
MidasVolumeProfile
Indikator
Versi 1.3, Oct 2026
Windows, Mac
Trading product for MidasVolumeProfile Indikator Key Levels Volume, image 2
Trading product for MidasVolumeProfile Indikator Key Levels Volume, image 3
Trading product for MidasVolumeProfile Indikator Key Levels Volume, image 4
Sejak 27/09/2026

Penerangan

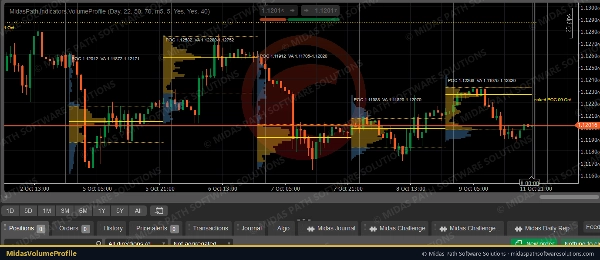
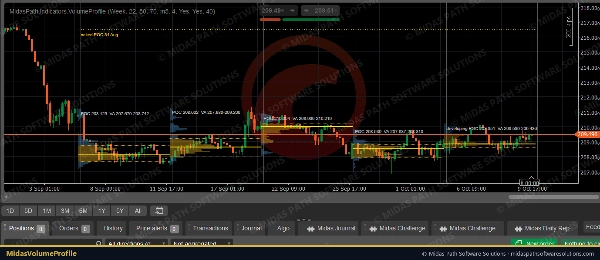
Midas Volume Profile shows where volume traded in each day or week, drawn as a histogram at the start of the session, with the levels profile traders use.


What it shows

• A volume histogram for each session, with the value area highlighted.

• POC (point of control): the price row with the most volume, drawn across the session.

• Value area high and low (VAH / VAL): the range around the POC that holds 70% of the session's volume (adjustable).

• Naked POCs: earlier sessions' POCs that price has not traded through since, extended to the right until price touches them.

• The developing profile of the current session, updated as each candle closes.


How it is built

• Volume is cTrader's tick volume (the number of price updates), the usual measure in forex and CFDs, where there is no central exchange volume. It is taken from a lower timeframe (5 minutes by default) for detail.

• Each candle's volume is shared across the price rows its high-low range covers, in proportion to the overlap. The session's range is split into 50 rows (adjustable).

• The value area grows from the POC towards whichever neighbouring row holds more volume, until it holds the chosen share.


Settings

• Profiles per day or per week, session start hour (22:00 UTC by default, the forex day), rows, value-area share, volume timeframe.

• Number of sessions shown, developing session on or off, naked POCs on or off, histogram width and colours.


Tested

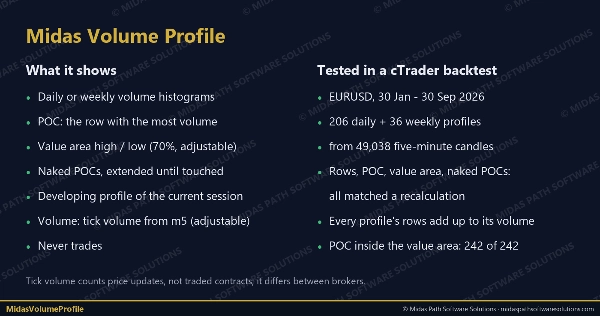
• In a cTrader backtest on EURUSD (30 Jan-30 Sep 2026), all 206 daily and 36 weekly profiles built from 49,038 five-minute candles matched an independent recalculation: session boundaries, every row's volume (each profile's rows add up to its total volume), POC, value area and every naked-POC touch.

• On that data the POC sat inside the value area in every profile, the value area held 71% of volume on average (rows are whole, so it slightly exceeds 70%), and 10 daily and 2 weekly POCs were still naked at the end.


Notes

• Tick volume counts price changes, not traded contracts; it differs between brokers.

• Volume profiles describe where trading happened; they do not predict where price will go.

• It never trades and needs no internet or file access.

Ringkasan

Ringkasan AI
Midas Volume Profile is an indicator that visualizes session volume distribution using tick volume data, primarily for forex and CFD markets where centralized volume is unavailable. It displays a histogram of traded volume for each day or week at the session start, highlighting key levels used by volume profile traders.

Key features include:
- Point of Control (POC): the price level with the highest traded volume, extended across the session.
- Value Area High and Low (VAH/VAL): price range around the POC containing approximately 70% of the session’s volume, adjustable by the user.
- Naked POCs: POCs from previous sessions that price has not revisited, extended until touched.
- A developing profile for the current session, updated with each candle close.

The indicator calculates volume by distributing each candle’s tick volume proportionally across price rows within its high-low range, dividing the session range into adjustable rows (default 50). It supports profiles per day or week, customizable session start times, and visual settings such as histogram width and colors.

Midas Volume Profile operates without trading or internet access and has been tested for accuracy against independent recalculations on EURUSD data. It provides a detailed view of where trading activity concentrates but does not predict price direction.
Profil indikator
Kategori indikator
Volum
Jenis output
Visualisasi
Keperluan data
Bar sahaja

Perbincangan

Ulasan pelanggan

0.0
Ulasan: 0
Ulasan pelanggan
Belum ada ulasan untuk produk ini. Anda sudah mencuba produk tersebut? Jadilah yang pertama untuk berkongsi pendapat anda!

Soalan Lazim

Key Levels
Volume
Support & Resistance
Produk yang tersedia melalui cTrader Store, termasuk bot dagangan, indikator dan plugin, disediakan oleh pembangun pihak ketiga dan diberikan akses untuk tujuan maklumat dan teknikal sahaja. cTrader Store bukan broker dan tidak memberikan nasihat pelaburan, syor peribadi atau sebarang jaminan prestasi masa hadapan.

Lebih banyak produk daripada penulis ini
Plugin desktop
File Access
Trade Journal
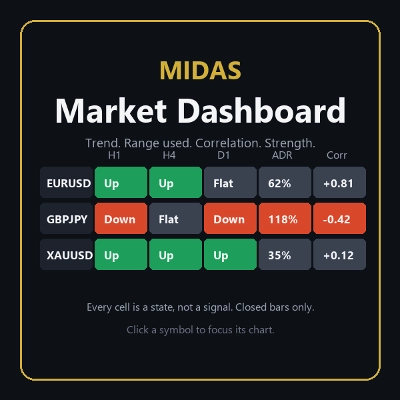
Your watchlist in one grid: trend on five timeframes, ADR used, correlation to the chart's symbol, currency strength.
Indikator
Key Levels
Liquidity Grab
+2
The levels you mark each morning, drawn and followed: PDH/PDL, weekly, monthly, sessions, equal highs/lows.
cBot
Partial Close
Prop Firm Fit
Copies opens, closes, partial closes and SL/TP from one cTrader account to others on the same PC, with safe sizing.
Plugin desktop
External Data
Study economic event reactions with broker M1 history, bar replay, range comparisons and a reproducible export.

Anda juga mungkin suka

Indikator
ATR
BOS
+5
Opening ranges, dynamic trend channels, and multi-scale breakout/retest analysis for clear intraday chart decisions.
Indikator
Forex
BTCUSD
+4
This indicator is designed to perform multiple non-linear regression analysis using four independent variables.
Indikator
Forex
Crypto
+4
Spot powerful 3-candle reversal patterns like Morning/Evening Star and Soldiers/Crows at key swing highs and lows
Indikator
Three ZigZag lines
Indikator
AI
ATR
+27
Smart Money Gaps: MTF FVG auto-detection, extension, and mitigation marker. Trade institutional imbalances.
Indikator
Doji
Wedge
+5
Angora Pattern Recognition is a cTrader indicator that finds, draws and tracks classic chart patterns automatically.
Indikator
AI
ATR
+10
FX Sniper: Multi-pair Forex analysis tool. Features trend logic, adaptive pivots, and momentum filtering for major pairs
Indikator
VWAP
Volume
+3
Don't trust static support and resistance levels, this indicator combines Fibonacci and VWAP in one powerful tool.
Indikator
BOS
EMA
+5
VWAP Bands indicator with 3 standard deviation levels, buy/sell zones, and a draggable ON/OFF button to toggle the entir
Indikator
ATR
RSI
+1
Super Trend Rsi ,ATR + trend change distance + dynamic Alpha, divergence/convergence
Indikator
The long awaited new and improved Supply Demand Premium V2 indicator. Unlock greater trading opportunities now!
Indikator
Fair Value Gap
Liquidity Grab
+2
PRO Liquidity Sweep + FVG Combo detector with custom Gold/Blue signals & alerts
Indikator
RSI
Breakout
+1
Dynamically adjusts regression channels based on ZigZag extremes, resetting when price breaks bands to track real trends
Indikator
ATR
RSI
+7
Identify bullish and bearish Order Blocks to spot key support/resistance levels and potential trend reversals! 📈🔄
Indikator
ATR
BTCUSD
+5
Trailing algo 📈 auto-tracks trends 🎯 adapts to volatility 🌟 precise moves 🛡️ retest signals 🚀 no lag, smart market
Indikator
BOS
MSS
+2
Stay ahead with a real-time countdown to candle closes on all key timeframes: 5m, 15m, 30m, 1H, 4H, and Daily.
Indikator
Forex
Crypto
+3
Enhance Pitchfork & Price Channels in cTrader with customizable Equidistant and Fibonacci levels.
Indikator
Volume
Key Levels
+4
Session & Kill Zone Highlighter - Visual tool for London, NY, Tokyo, Sydney sessions plus ICT Kill Zones.

Harga

Sejak 27/09/2026