Descripción
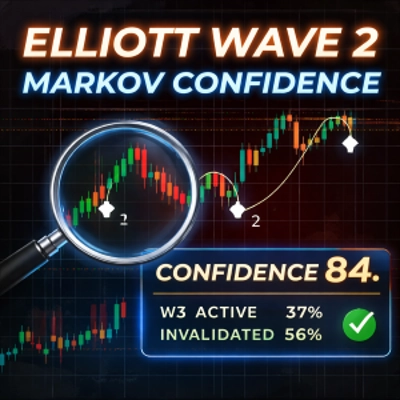
Elliott CLEAN — Wave2 + Markov Confidence
Elliott CLEAN es un indicador analítico avanzado diseñado para ayudar a los traders a identificar, validar y gestionar configuraciones de Elliott Wave 2 utilizando una combinación de estructura de mercado y probabilidad estadística.
En lugar de predecir la dirección del precio, el indicador se centra en transiciones estructurales y responde a una pregunta más útil:
¿Qué probabilidad hay de que una Wave 2 evolucione hacia una Wave 3 válida y sostenible — y cuánta confianza debería tener el trader en ese escenario?
Lo que hace este indicador
Elliott CLEAN automáticamente:
- Detecta estructuras Wave 1–Wave 2 basadas en pivotes de oscilación
- Define disparadores, stop-loss, invalidaciones y objetivos de Wave 3
- Rastrea resultados estructurales históricos usando un modelo de Markov de 5 estados
- Calcula probabilidades condicionales para:
-
- Activación de Wave 3
- Invalidación de la configuración
- Agotamiento temprano de Wave 3
- Convierte estas probabilidades en un único Puntaje de Confianza (0–100)
Esto permite a los traders filtrar configuraciones de baja calidad, evitar el sobre-trading y ejecutar operaciones solo cuando la estructura y las estadísticas se alinean.
Características principales
- ✅ Detección automática de Elliott Wave 2
- ✅ Múltiples modos de confirmación (Break+Hold, Break, Reclaim, Wick)
- ✅ Disparadores claros, stop-loss, invalidación y objetivos proyectados
- ✅ Motor de probabilidad Markov de 5 estados (basado en eventos/oscilaciones, no en barras)
- ✅ Probabilidades condicionales en tiempo real mostradas en el gráfico
- ✅ Único Puntaje de Confianza (0–100) para soporte en la toma de decisiones
- ✅ Diseño HUD limpio y no intrusivo
- ✅ Funciona en cualquier símbolo y cualquier marco temporal
El Puntaje de Confianza (Importante)
El Puntaje de Confianza no es una tasa de aciertos y no es una señal.
Es una métrica de calidad contextual derivada de transiciones estructurales históricas:
- Durante Wave 2, el puntaje refleja:
-
- La probabilidad de que comience Wave 3
- Ajustada por la probabilidad de fallo temprano
- Durante Wave 3, el puntaje refleja:
-
- La probabilidad histórica de que Wave 3 continúe sin agotamiento temprano
En la práctica:
- Puntajes bajos = la estructura es débil o poco confiable
- Puntajes altos = la estructura es rara pero estadísticamente robusta
Esto ayuda a los traders a decidir cuándo mantenerse cautelosos y cuándo dejar que una operación funcione.
Casos de uso típicos
- ✔ Filtrar configuraciones de Elliott Wave antes de la entrada
- ✔ Evitar operaciones marginales o de baja calidad en Wave 2
- ✔ Ajustar el tamaño de la posición basado en la confianza
- ✔ Gestionar operaciones de Wave 3 con menos interferencia emocional
- ✔ Apoyar el trading discrecional con datos objetivos de estructura
El indicador es especialmente útil para traders que ya entienden la teoría de Elliott Wave y desean confirmación cuantitativa sin automatización.
Cómo usarlo (flujo básico de trabajo)
- Adjuntar el indicador a un gráfico
- Seleccionar el modo de confirmación preferido
- Esperar una estructura válida de Wave 2
- Observar:
-
- Disparador, stop-loss, invalidación
- Probabilidades Markov
- Puntaje de Confianza
- Decidir si la configuración vale la pena operar basada en estructura + confianza
Notas importantes y descargo de responsabilidad
- Este indicador es analítico, no predictivo
- No genera señales de compra/venta
- Las estadísticas estructurales pasadas no garantizan resultados futuros
- El trading implica riesgos; los usuarios son totalmente responsables de sus decisiones
El indicador está destinado como una herramienta de apoyo a la decisión para traders discrecionales.
Para quién es este indicador
- Traders familiarizados con los conceptos de Elliott Wave
- Traders discrecionales que valoran la estructura sobre los indicadores
- Traders que buscan filtros objetivos, no sistemas automatizados
- Usuarios que quieren contexto de probabilidad, no etiquetas retrospectivas
_______________________
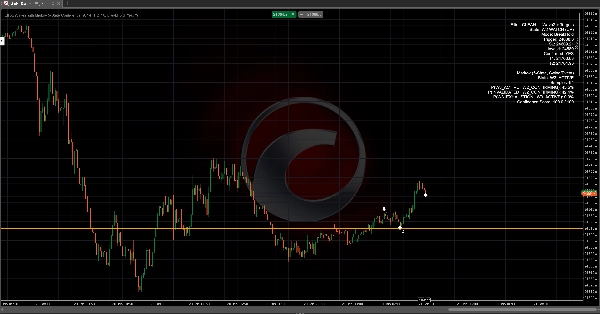
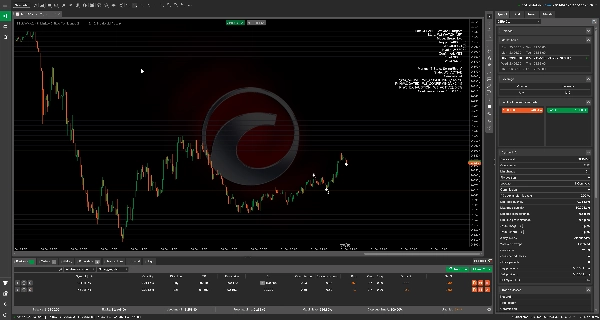
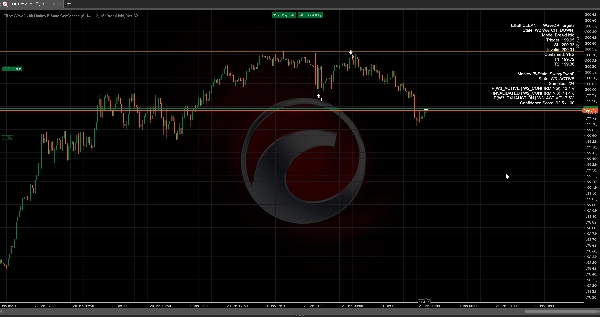
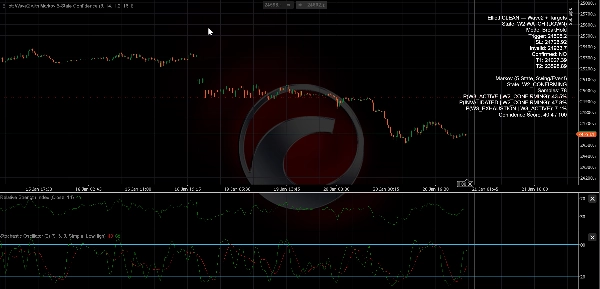
HUD y Estados
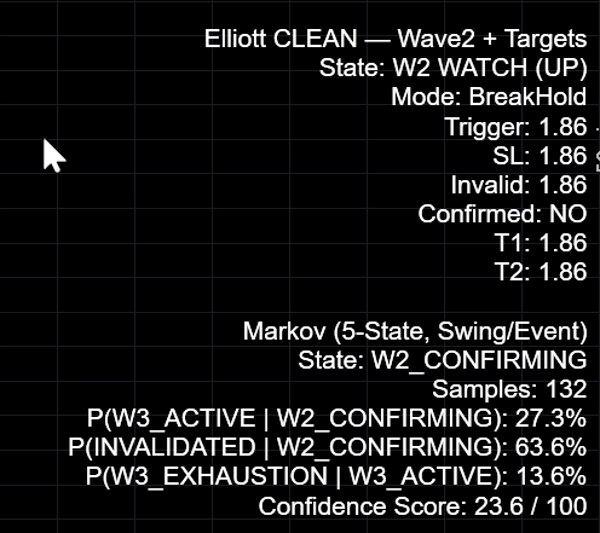
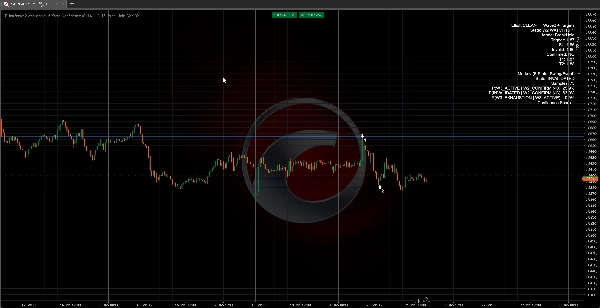
El indicador imprime niveles de estructura y probabilidades Markov directamente en el gráfico.
Capa central de Elliott:
- Estado: W2 WATCH (UP/DOWN) — potencial Wave 2 presente (estructura encontrada)
- Confirmado: SÍ/NO — la regla de confirmación seleccionada se ha activado
- Disparador — el precio del nivel debe romper/recuperar (depende del modo)
- SL — nivel de stop protector sugerido (depende del modo SL)
- Inválido — nivel de invalidación estructural (inicio de Wave 1)
- T1/T2 — proyecciones de Wave 3 usando multiplicadores
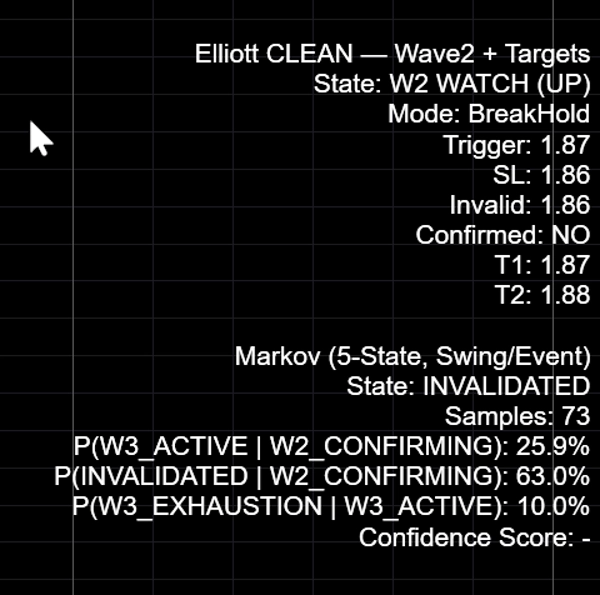
Capa Markov:
- Estado — estado Markov actual (por ejemplo,
W2_CONFIRMING,W3_ACTIVE,INVALIDATED) - Muestras — conteo histórico usado para probabilidades
- P(W3_ACTIVE | W2_CONFIRMING) — probabilidad de que Wave 3 se active desde la fase Wave 2
- P(INVALIDATED | W2_CONFIRMING) — probabilidad de que la configuración falle durante la fase Wave 2
- P(W3_EXHAUSTION | W3_ACTIVE) — probabilidad de que Wave 3 falle temprano una vez activa
Puntaje de Confianza (0–100)
El Puntaje de Confianza no es una tasa de aciertos ni una garantía. Es una métrica de calidad derivada de transiciones estructurales históricas.
Cómo se usa el puntaje:
- Durante
W2_CONFIRMING, el puntaje refleja la “probabilidad de activación” ajustada por el riesgo de fallo temprano. - Durante
W3_ACTIVE, el puntaje refleja la “robustez de continuación” (bajo riesgo de agotamiento temprano).
Siempre interprete el puntaje junto con: (1) claridad de la estructura, (2) distancia de invalidación y (3) tamaño de la muestra.
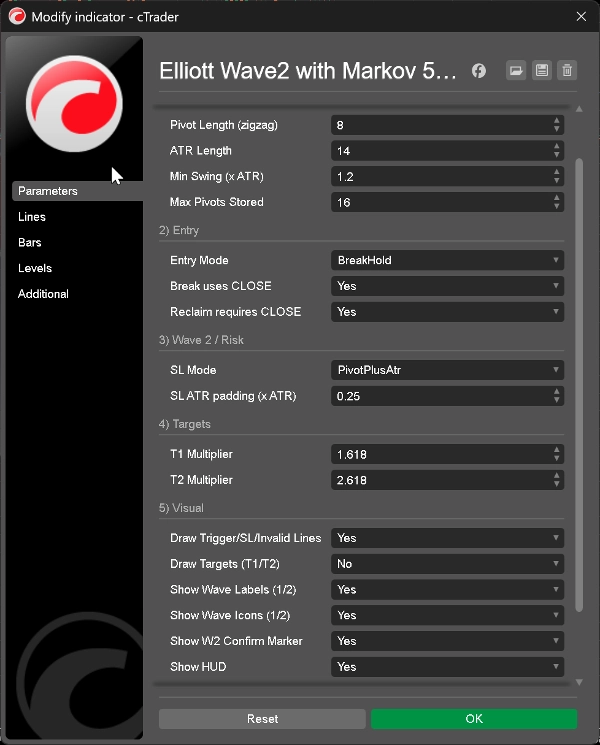
Entradas (Qué hacen)
1) Pivote / Estructura
- Longitud del pivote (zigzag): Controla la sensibilidad de oscilación. Más alto = menos oscilaciones, estructura más limpia.
- Longitud ATR: Ventana ATR usada para filtrado de oscilaciones y relleno opcional de SL.
- Oscilación mínima (×ATR): Tamaño mínimo de oscilación para aceptar un pivote (filtra ruido).
- Máximo de pivotes almacenados: Limita el historial de oscilaciones almacenado (rendimiento y estabilidad).
2) Entrada
- Modo de entrada: Elija el estilo de confirmación:
-
BreakHold— más seguro: romper y luego mantener más allá del disparadorBreak— más rápido: romper el disparador una vezReclaim— comportamiento de barrido + recuperaciónWick— agresivo: mecha a través del disparador
- Break usa CIERRE: Usa cierre en lugar de mecha para la lógica de ruptura (recomendado).
- Reclaim requiere CIERRE: Requiere un cierre en el lado correcto después del barrido.
3) Wave 2 / Riesgo
- Modo SL: Determina la línea base para la colocación del stop.
- Relleno SL ATR (×ATR): Buffer extra al usar stop basado en ATR.
4) Objetivos
- Multiplicador T1 / Multiplicador T2: Multiplicadores para proyección de Wave 3 (por defecto: 1.618 y 2.618).
5) Visual
- Dibujar líneas de disparador/SL/invalidez: Mostrar/ocultar niveles horizontales centrales.
- Dibujar objetivos: Líneas de objetivo opcionales (menos “limpio”).
- Mostrar etiquetas / íconos de Wave: Mostrar marcadores de onda (1/2).
- Mostrar marcador de confirmación W2: Muestra marcador de confirmación.
- Mostrar HUD: Mostrar/ocultar todo el HUD.
Cómo usar:
- Escanee múltiples mercados, luego concéntrese solo en entornos estructurales de mayor calidad.
- Use el puntaje + tamaño de muestra para decidir cuándo una configuración vale el tiempo y el riesgo.
Preguntas frecuentes
¿Funciona esto en todos los símbolos y marcos temporales?
Sí. Es un enfoque basado en la estructura. Los resultados y probabilidades variarán según el comportamiento y la volatilidad del mercado.
¿El Puntaje de Confianza es una tasa de aciertos?
No. Es un puntaje de calidad estructural derivado de transiciones de estado históricas (modelo Markov). No garantiza resultados.
¿Por qué el puntaje suele ser bajo durante Wave 2?
Porque la activación de Wave 3 es selectiva. Muchos candidatos a Wave 2 fallan o fluctúan. El indicador está diseñado para filtrar esos casos.
¿Y qué pasa con el tamaño de muestra pequeño?
Considere las probabilidades como menos estables cuando el tamaño de muestra es pequeño. Use el puntaje como contexto, no como certeza.
Descargo de riesgo
El trading implica riesgos y puede no ser adecuado para todos los inversores. El rendimiento pasado y la probabilidad histórica no garantizan resultados futuros. Este indicador proporciona información analítica únicamente y no constituye asesoramiento de inversión ni recomendación para comprar o vender ningún instrumento. Usted es responsable de sus propias decisiones, gestión de riesgos y cumplimiento de las regulaciones locales.
Elliott Wave, Estructura de Mercado, Análisis Técnico, Probabilidad, Análisis Estadístico, Swing Trading, Gestión de Riesgos, Soporte para la Toma de Decisiones
Resumen
Valoraciones de clientes
5 | 100 % | |
4 | 0 % | |
3 | 0 % | |
2 | 0 % | |
1 | 0 % |


