


Descrizione
Vetrina:
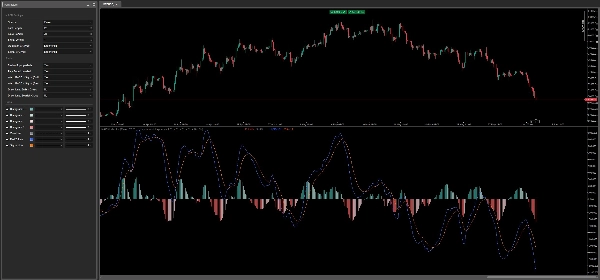
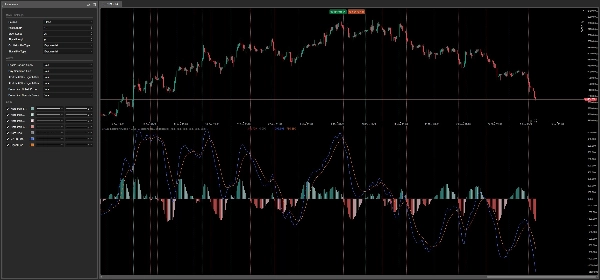
Indicatore MACD è una versione raffinata e visivamente migliorata del classico oscillatore Moving Average Convergence Divergence (MACD) per la piattaforma cTrader. Progettato per rispecchiare il comportamento e l'aspetto dell'originale TradingView, offre un'esperienza familiare e professionale con diversi aggiornamenti intelligenti.
Perché scegliere l'Indicatore MACD?
1. Compatibilità al 100% con TradingView
L'algoritmo principale segue esattamente la stessa logica del MACD standard su TradingView. Calcola la linea MACD come la differenza tra una media mobile veloce e una lenta, ricava una linea di segnale da una terza media mobile e traccia l'istogramma come differenza tra le due. Il risultato è un allineamento perfetto al pixel con i grafici che già conosci.
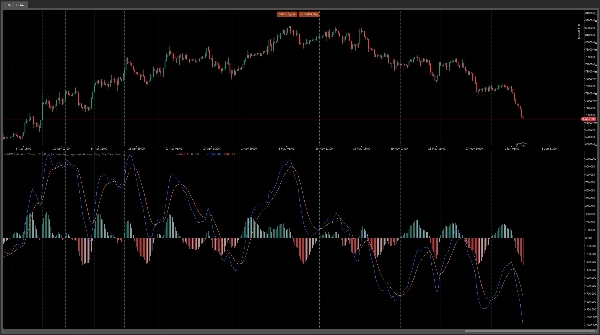
2. Istogramma Intelligente a 4 Colori
Invece di un semplice istogramma a due toni, questo indicatore utilizza un sistema dinamico a gradiente di quattro colori identico all'implementazione PineScript di TradingView:
- Positivo Forte – la barra dell'istogramma è sopra lo zero *e* in crescita
- Positivo Debole – la barra dell'istogramma è sopra lo zero *ma* in calo
- Negativo Debole – la barra dell'istogramma è sotto lo zero *ma* in crescita
- Negativo Forte – la barra dell'istogramma è sotto lo zero *e* in calo
Questa intelligenza cromatica ti permette di valutare immediatamente se il momentum sta accelerando o indebolendosi, senza dover interpretare numeri grezzi.
3. Sistema di Allerta Integrato con Pop-up e Suono*
Rimani informato anche quando sei lontano dallo schermo. L'indicatore può inviarti notifiche pop-up native di cTrader e riprodurre suoni distinti quando:
- La linea MACD incrocia verso l'alto la linea di segnale (Incrocio Rialzista – segnale di acquisto)
- La linea MACD incrocia verso il basso la linea di segnale (Incrocio Ribassista – segnale di vendita)
Ogni tipo di allerta può essere attivato indipendentemente, e il sistema è protetto contro allarmi duplicati sulla stessa barra.
4. Segnali Visivi Personalizzabili
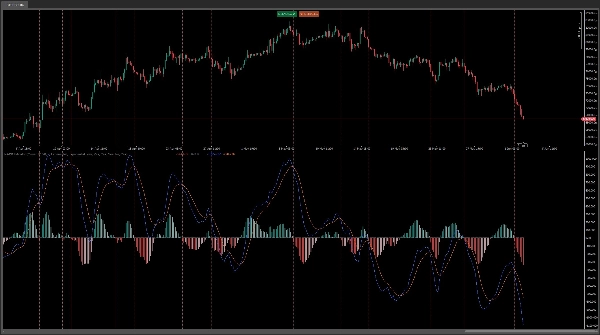
Puoi opzionalmente disegnare linee verticali tratteggiate sul grafico ogni volta che si verifica un incrocio rialzista o ribassista. Questo rende facile scansionare i grafici storici e identificare rapidamente le zone di segnale passate, senza dover scorrere manualmente i dati.
5. Completamente Personalizzabile e Flessibile
Regola ogni aspetto dell'indicatore per adattarlo al tuo stile di trading:
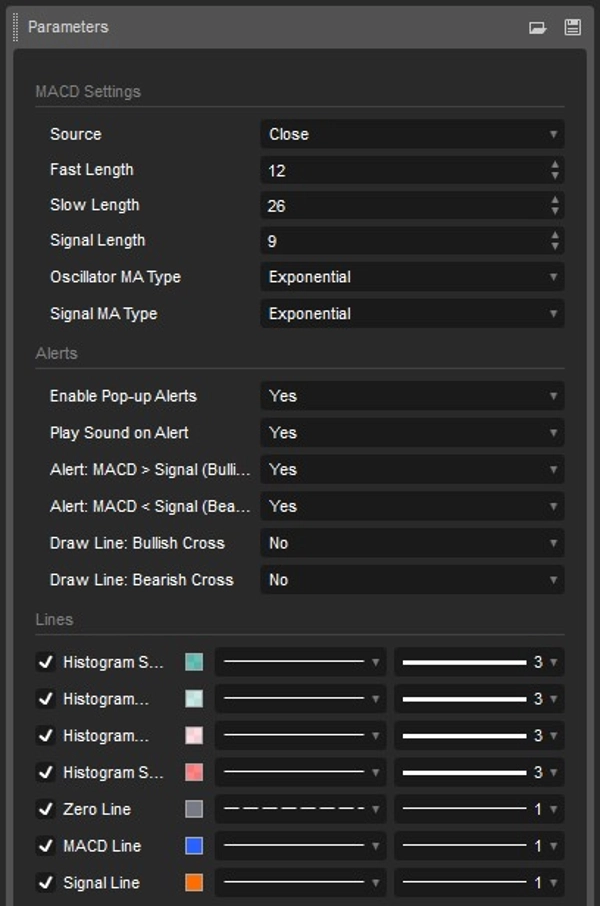
- Fast Length – periodo per la media mobile veloce
- Slow Length – periodo per la media mobile lenta
- Signal Length – periodo per la media mobile della linea di segnale
- Oscillator MA Type – scegli tra qualsiasi tipo di media mobile (EMA, SMA, ecc.) per il calcolo del MACD
- Signal MA Type – seleziona indipendentemente il tipo di media mobile per la linea di segnale
Per chi è questo indicatore?
Utenti esperti di TradingView che desiderano un MACD nativo per cTrader che si comporti, calcoli e colori esattamente come l'originale – nessuna sorpresa, nessuna discrepanza.
Trader discrezionali che cercano avvisi chiari di crossover in tempo reale con notifiche pop-up e suono, facilitando l'ingresso senza dover fissare lo schermo tutto il giorno.
Trader analitici che apprezzano l'istogramma a quattro colori come strumento diagnostico del momentum – identificano rapidamente se la pressione rialzista o ribassista sta aumentando o diminuendo.
Tutti i livelli di esperienza – il MACD è un oscillatore fondamentale, e questa implementazione lo rende più accessibile che mai con le sue visuali pulite, la codifica intelligente dei colori e il sistema di allerta completamente configurabile.
cGuru
Riepilogo
This indicator includes a built-in alert system with customizable pop-up and sound notifications for bullish and bearish MACD-signal line crossovers, with options to toggle alerts independently and prevent duplicates. Users can also enable vertical dotted lines on the chart to mark crossover events for easier historical analysis.
All parameters are fully customizable, including the periods for fast, slow, and signal moving averages, as well as the types of moving averages used (EMA, SMA, etc.). The indicator supports signals for crossovers and trend strength, and requires bar or tick data input. It is suitable for traders seeking a TradingView-compatible MACD with enhanced visual cues and real-time alerts on the cTrader platform.

















![Logo di "[Hamster-Coder] Bollinger Bands"](https://cdn.ctrader.com/image/webp/21d8e5d6-fb11-4bac-b9ee-cd05c2b76804_30327)








