
Descrizione
Market Cipher A è un indicatore tecnico avanzato progettato per un'analisi facile, l'identificazione e la previsione delle tendenze macro nel mercato delle criptovalute.
Struttura e Componenti
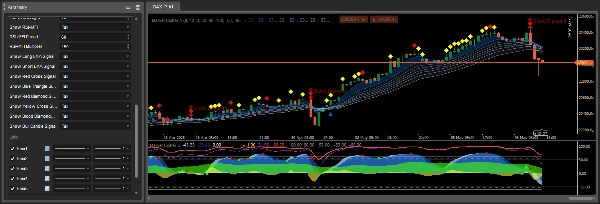
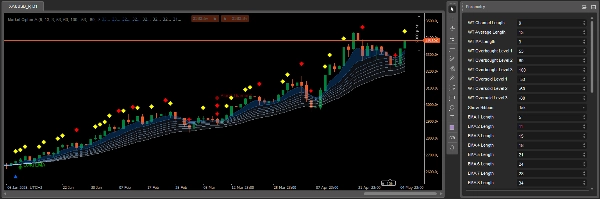
Market Cipher A consiste in un nastro di 8 medie mobili esponenziali (EMA) che cambiano colore a seconda della tendenza di mercato. Il nastro EMA diventa blu o bianco durante un mercato toro e grigio durante un mercato orso.
Per impostazione predefinita, vengono utilizzate medie mobili con valori EMA da 5 a 34. Gli incroci di queste linee possono essere indicatori ritardati molto forti, motivo per cui Market Cipher A è stato programmato per mostrare automaticamente simboli corrispondenti a diversi segnali, eliminando la necessità di interpretazione manuale di ogni incrocio rialzista o ribassista.
Simboli e Segnali di Trading
Market Cipher A mostra simboli caratteristici direttamente sul grafico a candele che indicano potenziali opportunità di trading:
Triangolo Blu - segnale di inversione di tendenza, indica un calo del momentum e un'inversione imminente. È un avvertimento precoce che il momentum della tendenza sta diminuendo.
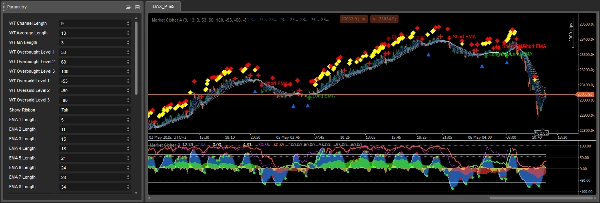
Cerchio Verde - indicatore rialzista, più affidabile su timeframe di 6 ore e superiori. Appare tipicamente dopo un triangolo blu e dovrebbe essere interpretato entro un intervallo di 1-3 candele.
Diamanti Gialli - indicano la continuazione di una tendenza al rialzo. Devono essere usati insieme al nastro EMA per una migliore conferma della direzione della tendenza.
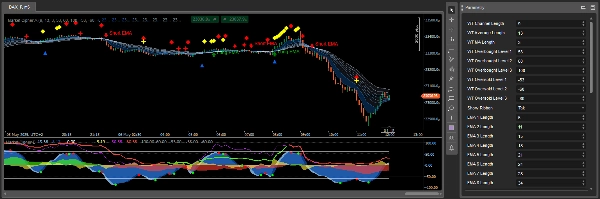
Diamanti Rossi - segnalano un indebolimento della tendenza e una possibile continuazione al ribasso. Indicano un aumento del momentum ribassista.
X Rossa - indicatore ribassista, più efficace su timeframe di 1 ora e superiori. Deve essere usata insieme al nastro EMA e al diamante rosso.
X Gialla - indica manipolazione del mercato, in particolare una copertura di posizioni long di grandi dimensioni che viene rapidamente acquistata e venduta da posizioni short.
Grande Diamante Rosso (Blood Diamond) - il segnale più ribassista, che indica alta probabilità di un calo, specialmente quando si verifica insieme a una X rossa o a un diamante rosso più piccolo.
Principi di Utilizzo
Market Cipher A fornisce un forte supporto o resistenza matematica visivamente, permettendo una facile comprensione dell'ambiente di trading. Funziona meglio con candele Heiken Ashi.
Il nastro EMA non solo indica la tendenza ma agisce anche come livelli dinamici di supporto e resistenza. Quando il nastro è blu/bianco e le candele sono sopra di esso, si possono cercare opportunità per posizioni long. Quando il nastro è grigio e le candele sono sotto di esso, si possono considerare posizioni short.
I migliori risultati si ottengono quando i segnali di Market Cipher A sono combinati con altri indicatori del pacchetto Market Cipher, in particolare Market Cipher B, che fornisce segnali di momentum aggiuntivi e punti di ingresso.
Interpretazione Dettagliata dei Segnali nel Contesto della Tendenza
Un aspetto importante di Market Cipher A è l'interpretazione contestuale dei segnali a seconda della tendenza dominante. Quando il nastro cambia colore da grigio a blu, l'indicatore genera un cerchio verde come segnale per l'inizio di una tendenza al rialzo. Normalmente, dopo un cerchio verde, se nelle successive 1-3 candele appare un diamante giallo, la probabilità di una rottura è alta. Tuttavia, se compaiono diamanti rossi, la rottura è meno probabile.
Durante un mercato toro, i diamanti gialli sono favorevoli, mostrando una continuazione al rialzo in linea con la tendenza, mentre i diamanti rossi rappresentano un movimento contro-tendenza. In un mercato orso, la situazione è invertita - i diamanti rossi sono favorevoli come continuazione del calo, e i diamanti gialli indicano un movimento temporaneo al rialzo contrario alla tendenza.
La X rossa è più affidabile quando appare dopo un diamante rosso e il nastro EMA è quasi completamente contratto, cambiando colore in grigio ribassista. L'accuratezza di questo indicatore varia a seconda del timeframe.
Meccanismo di Funzionamento e Genesi dei Segnali
I simboli e i segnali in Market Cipher A sono generati basandosi su diverse fonti: incroci delle onde WaveTrend, livelli di ipercomprato e ipervenduto, e basandosi su RSI e MFI quando attraversano la linea centrale o raggiungono condizioni di ipercomprato e ipervenduto. Questa analisi multidimensionale rende i segnali più completi rispetto ai singoli indicatori.
Il nastro EMA è composto da 8 medie mobili che formano un nastro caratteristico con separazione tra le singole bande. La separazione delle bande è un fattore importante - una separazione ampia indica una tendenza forte, mentre bande ristrette suggeriscono un indebolimento del momentum o una fase di consolidamento.
Applicazione Pratica nelle Strategie di Trading
Market Cipher A è stato progettato principalmente come strumento di analisi della tendenza, quindi funziona meglio nelle strategie di trend following. Si consiglia di usare il nastro insieme ad altri indicatori di identificazione della tendenza, quindi cercare opportunità di trading durante i ritracciamenti del prezzo.
È importante ricordare che questi segnali aiutano a perfezionare il timing di ingresso o uscita dalle operazioni, ma non devono essere usati da soli per prendere decisioni di trading. Sono necessarie conferme aggiuntive, specialmente per i segnali di inversione che si verificano durante movimenti di prezzo laterali.
Riepilogo
The indicator automatically displays distinct symbols on the price chart to signal potential trading opportunities:
- Blue Triangle: signals declining momentum and possible trend reversal.
- Green Circle: indicates a bullish trend start, most reliable on 6-hour timeframes and above.
- Yellow Diamonds: suggest continuation of an upward trend.
- Red Diamonds: indicate trend weakening and potential downward continuation.
- Red X: bearish signal effective on 1-hour timeframes and higher.
- Yellow X: points to market manipulation events.
- Large Red Diamond ("Blood Diamond"): strong bearish signal with high probability of decline.
Signals are generated using a combination of WaveTrend crossovers, RSI, and MFI indicators, providing multidimensional market analysis. Market Cipher A is optimized for use with Heiken Ashi candles and is best applied within trend-following strategies, ideally combined with other Market Cipher indicators for enhanced entry and momentum confirmation.
Recensioni dei clienti
5 | 67 % | |
4 | 33 % | |
3 | 0 % | |
2 | 0 % | |
1 | 0 % |


