
说明
一个变成交易系统的指标
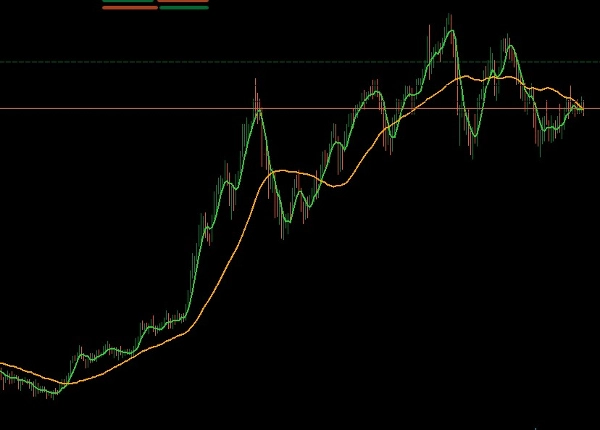
当该指标用于周线图时,确实可以成为一个完整的交易系统。它的主要优势在于过滤掉短期时间框架中典型的市场噪音,只向您展示关键的长期方向。
基于趋势的交易策略
成功的主要条件是交易者能够识别横盘整理的结束(盘整)。当一个工具最终突破这段不确定期,且指标自信地指向一个新方向时,那就是进入市场的最佳时机。
由于交易是在周线图上进行的,它专注于捕捉主要趋势。因此,一个耐心的交易者如果能准确地在趋势开始时入场,可以从单笔交易中获得非常好的利润。这个指标从一个简单的工具转变为一个直接而强大的交易策略基础,适合那些愿意等待并交易主要趋势的人。
摘要
AI 摘要
TwoSMA.cs is a trend indicator designed for use on weekly charts to identify long-term market direction by filtering out short-term noise. It helps traders recognize the end of sideways consolidation phases, signaling the start of new trends. By focusing on major trend movements, it supports a patient trading approach aimed at capturing significant price shifts from a single entry. The indicator is applicable across multiple markets including Forex, Indices, Crypto, and Stocks. It serves as the foundation for a trend-based trading strategy that emphasizes clear directional signals and timing entries at breakout points on weekly timeframes.
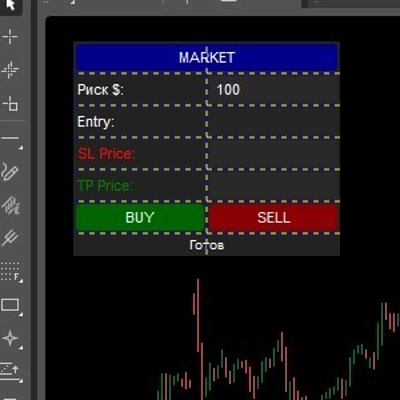
指标配置
客户评价
4.0
评价:1
5 | 0 % | |
4 | 100 % | |
3 | 0 % | |
2 | 0 % | |
1 | 0 % |
客户评价
February 18, 2026
TwoSMA.cs offers a clean dual Simple Moving Average setup to show trend direction and crossover signals. It’s lightweight, stable and works across timeframes. Best used alongside other tools to avoid noisy signals, especially on lower TF. A solid foundation trend filter, but not a full standalone signal system.
讨论
常见问答
Forex
Indices
Crypto
Stocks
cTrader Store 提供的所有产品,包括交易机器人、指标和插件,均由第三方开发者提供,仅供信息参考和技术访问之用。cTrader Store 并非经纪商,不提供投资建议、个人推荐或任何未来业绩保证。


猜您喜欢


价格
注册日期 11/01/2025
4
销售
431
免费安装