Description
TwoSMA PRO 2.0
Weekly Trend Analysis & Crossover Signals
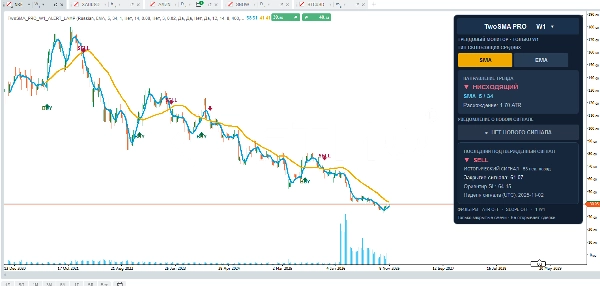
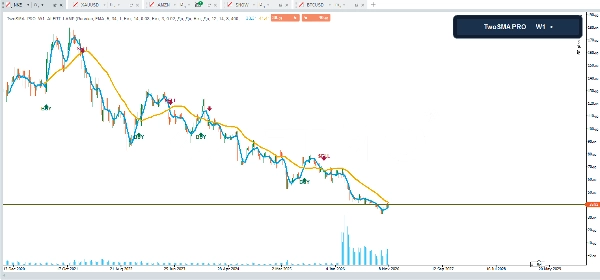
TwoSMA PRO brings weekly moving average analysis, confirmed crossover signals and an interactive dashboard into one chart indicator. Follow the trend, review historical signals and adjust optional filters to suit your analytical approach.
KEY FEATURES
• EMA / SMA switching with adjustable fast and slow periods.
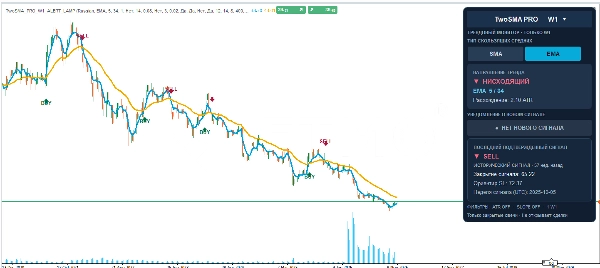
• Dark dashboard showing trend direction, moving average settings, ATR separation and the latest confirmed signal.
• BUY / SELL arrows and labels based on completed weekly candles.
• Optional ATR separation and moving average slope filters, with adjustable weekly confirmation.
• Visual reversal alert lamp, with optional popup and sound notifications.
• Historical signal dates, prices and reference levels.
• English and Russian interface with collapsible dashboard details.
HOW TO USE
1. Install the indicator and add it to a Weekly (W1) chart in cTrader Desktop.
2. Choose EMA or SMA and set the fast and slow periods.
3. Adjust confirmation and optional filters, then choose the chart labels and alerts you want to display.
4. Read the dashboard together with the confirmed chart signals. A bullish crossover produces a BUY marker; a bearish crossover produces a SELL marker.
COMPATIBILITY & SCOPE
Designed for the Weekly (W1) timeframe in supported cTrader Windows and Mac environments. Signals are confirmed on completed weekly candles; they do not predict the final direction of a week that is still open.
BUY / SELL markers are analytical signals. The displayed SL reference is a chart reference, not an order placed with your broker. The indicator does not open, close or modify trades.
TwoSMA PRO — Clarity. Control. Confidence.
Summary
Discussion
Customer reviews
5 | 40 % | |
4 | 60 % | |
3 | 0 % | |
2 | 0 % | |
1 | 0 % |