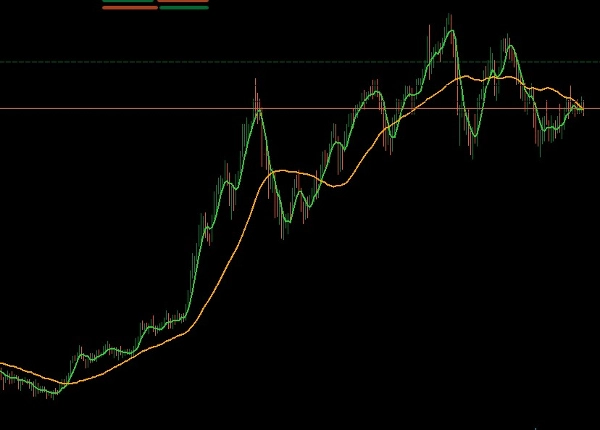
Description
An Indicator that Becomes a Trading System
SHORT DESCRIPTION
Free dual SMA chart overlay with customizable periods for simple trend and crossover analysis.
FULL DESCRIPTION
TwoSMA.cs is a lightweight chart-overlay indicator that displays two Simple Moving Averages directly on the price chart.
KEY FEATURES
• Fast and Slow Simple Moving Average lines
• Default periods: Fast SMA 5 and Slow SMA 34
• Fully adjustable moving-average periods
• Customizable line colors
• Compatible with different symbols and chart periods
• Clean and easy-to-read chart display
HOW TO READ THE INDICATOR
• Fast SMA above Slow SMA indicates a bullish trend context.
• Fast SMA below Slow SMA indicates a bearish trend context.
• A crossover may indicate that market direction is changing.
Longer chart periods generally produce smoother signals, while shorter periods may contain more market noise.
IMPORTANT
This indicator is a visual analysis tool. It does not open or manage trades, provide guaranteed entry signals, or guarantee trading results. Moving averages are lagging indicators and should be combined with independent analysis and risk management.
Summary
Customer reviews
5 | 0 % | |
4 | 100 % | |
3 | 0 % | |
2 | 0 % | |
1 | 0 % |