
HIO Mutil Currency CCI Scanner
指标
版本 1.0, May 2026
Windows 版、Mac 版
4.5
评价:2
说明
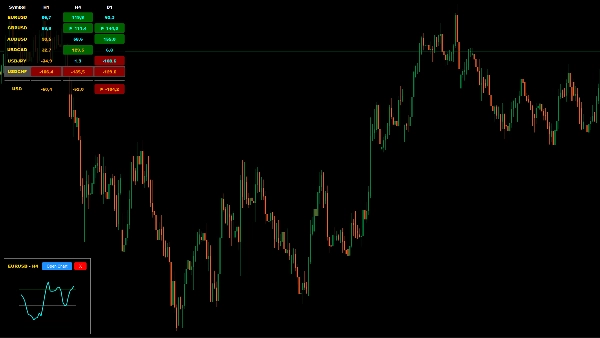
HIO 多货币 CCI 扫描器 是一个定制的 cTrader 指标,旨在优化您的交易工作区。该指标无需在多个打开的图表之间切换,而是提供了一个集中式仪表板,能够同时监控多个符号和时间框架的商品通道指数(CCI)值。它旨在帮助交易者从单一面板识别潜在的市场极端和趋势延续。
主要功能
- 多符号和时间框架矩阵: 在您的 cTrader 图表上通过单一统一面板监控用户定义的符号和时间框架。
- 货币强度计算: 具备集成的计量器,使用基于成交量加权的 CCI 算法估算目标货币强度。
- 交互式迷你图表: 点击仪表板中的任意数据单元格即可打开浮动迷你图表,让您无需离开主工作区即可查看详细的 CCI 线。
- 集成 Telegram 警报: 连接您的 Telegram 机器人,当单个时间框架或所有时间框架的汇合进入或退出您预定义的极端区域时接收通知。
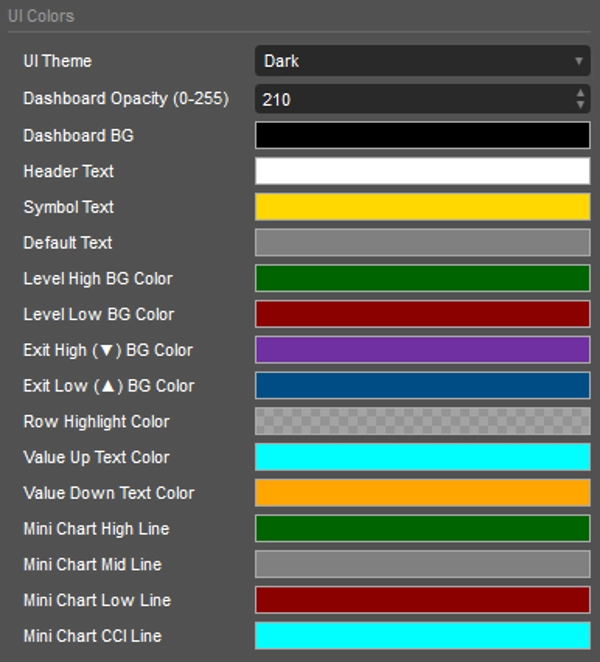
- 可定制的用户界面: 完全自适应设计,提供浅色、深色或自定义配色主题,完美融入您偏好的 cTrader 环境。
设置与参数
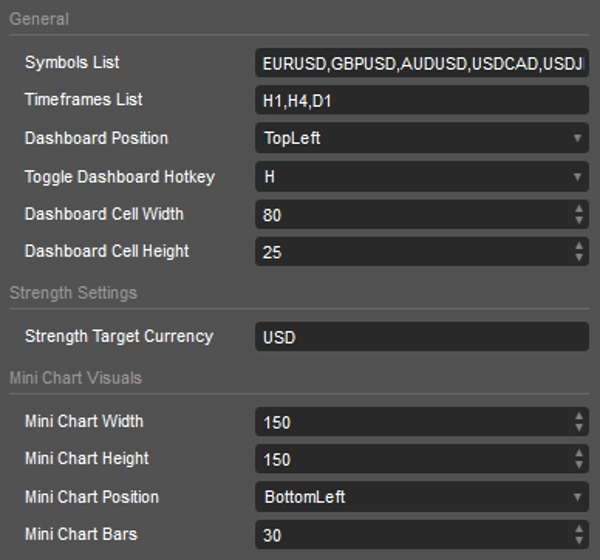
- 符号和时间框架: 使用逗号分隔的值输入您想要的资产和时间框架(例如,EURUSD, GBPUSD 和 h1, h4, d1)。
- 目标货币: 定义强度计量器计算的基础货币(例如,USD)。
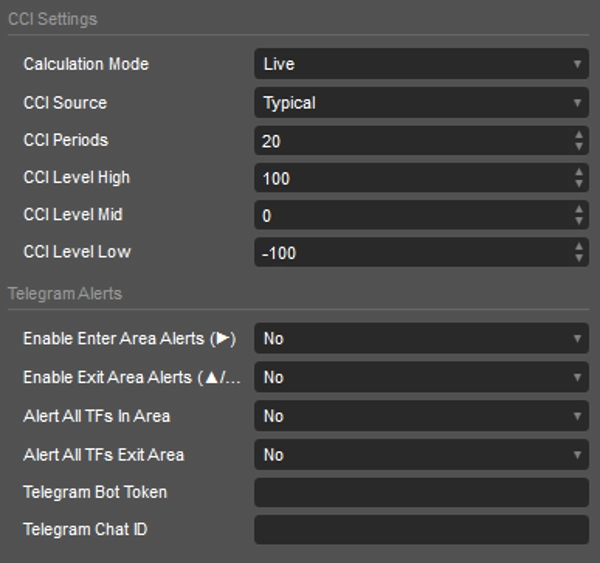
- CCI 设置: 自定义核心参数,包括计算模式(实时/收盘)、数据源(例如,收盘价、高价、低价)、周期以及特定的超买/超卖阈值。
- 警报配置: 输入您的 Telegram 机器人令牌和聊天 ID 以启用远程推送通知。
仪表板图例(颜色与符号)
仪表板使用视觉提示快速传达动量数据:
- 深绿色背景: CCI 当前处于超买区。
- 深红色背景: CCI 当前处于超卖区。
- 紫色/蓝色背景: CCI 正在积极地从极端区域回撤穿越。
- ▶ (进入): 动量正在积极进入极端阈值。
- ▼ (下跌/退出): 退出超买区域,表明潜在的下行动量。
- ▲ (上涨/退出): 退出超卖区域,表明潜在的上行动量。
注意:此工具旨在用于分析目的,辅助您在 cTrader 中的技术分析工作流程。
摘要
指标配置
指标分类
动量
输出类型
可视化
信号
过滤器
数据要求
仅 K 线
跳动点数据
交易量
支持的信号
交叉
背离
趋势强度
波动性
触及水平位
突破水平位
反转
客户评价
4.5
评价:2
5 | 50 % | |
4 | 50 % | |
3 | 0 % | |
2 | 0 % | |
1 | 0 % |
讨论
常见问答
Volume
CCI
cTrader Store 提供的所有产品,包括交易机器人、指标和插件,均由第三方开发者提供,仅供信息参考和技术访问之用。cTrader Store 并非经纪商,不提供投资建议、个人推荐或任何未来业绩保证。
该作者的其他作品


价格
注册日期 12/06/2025
1
销售
316
免费安装