
说明
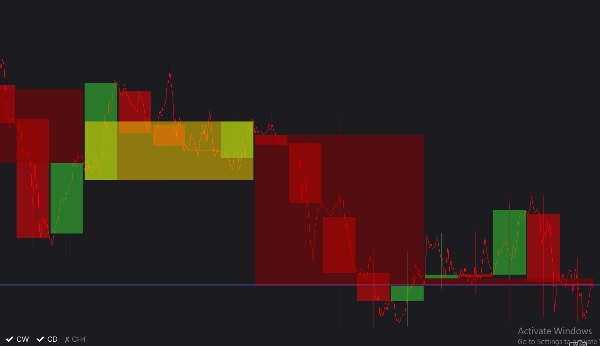
详细介绍 (ViPi) MTF蜡烛图是一款高度互动且可定制的图表工具,旨在让交易者无需离开当前活跃图表即可获得自上而下的市场视角。通过无缝叠加最多三个不同的更高时间框架(MTF)蜡烛图到您当前的视图中,您可以轻松一目了然地发现宏观经济趋势、关键支撑/阻力位和市场变化。它配备了一个简洁且不干扰图表的切换菜单,允许您即时隐藏或显示每个时间框架,确保您的工作空间保持整洁和专注。
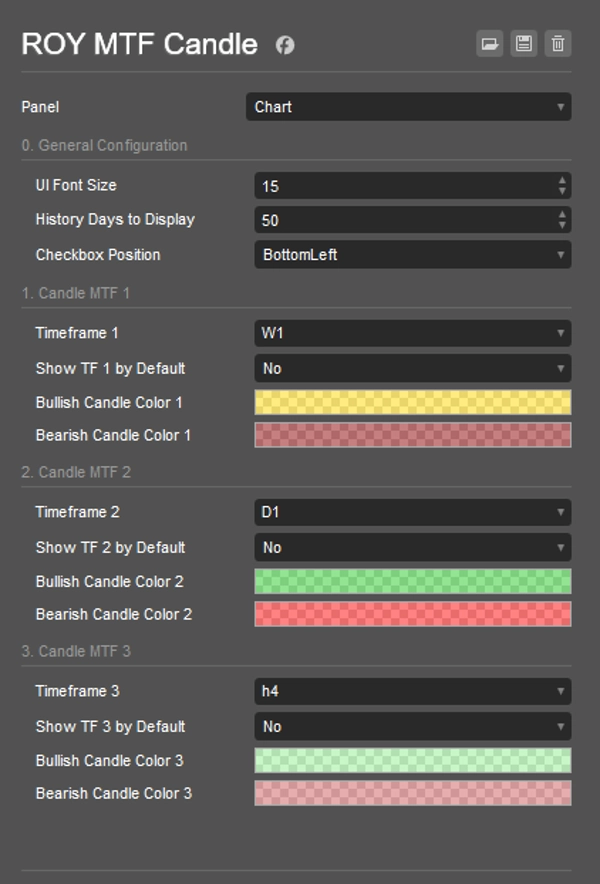
完整参数列表
- 界面字体大小: 调整图表上交互式切换按钮的文字大小。可设置范围为8到30(默认值:11)。
- 显示历史天数: 决定指标绘制历史MTF蜡烛图的天数(默认值:50天)。
- 复选框位置: 允许您将界面切换菜单锚定在图表的任意角落:左上、右上、左下或右下(默认值:左下)。
- 时间框架1、2、3: 您希望监控的具体更高时间框架。(默认分别为周线、日线和4小时线)。
- 默认显示时间框架1、2、3: 切换每个时间框架的蜡烛图在指标应用到图表时是否立即可见(默认值:否)。
- 看涨/看跌蜡烛颜色: 允许完全自定义三个时间框架中上涨和下跌蜡烛的颜色,支持透明度以避免遮挡您的主图表。
使用指南
- 附加到图表: 将(ViPi) MTF蜡烛图指标加载到您当前活跃的cTrader工作区。
- 配置时间框架: 打开设置,选择最多三个宏观时间框架(例如周线、日线和H4),与您当前的时间框架一起监控。
- 自定义视觉效果: 调整每个时间框架看涨和看跌蜡烛的颜色和透明度,使其与您的背景形成良好对比。
- 即时切换可见性: 使用方便的图表上交互按钮(位于您选择的复选框位置)快速点击,切换特定MTF叠加的显示或隐藏,辅助您的分析。
摘要
AI 摘要
(ViPi) MTF Candles is a charting indicator for cTrader that overlays up to three higher timeframe (multi-timeframe, MTF) candlestick charts directly onto the current chart. This tool enables traders to analyze broader market trends, key support and resistance levels, and shifts in market sentiment without switching charts. Users can customize the displayed timeframes—commonly Weekly, Daily, and 4-hour—and adjust the number of historical days shown. The indicator includes an on-chart toggle menu, which can be positioned in any corner of the chart, allowing quick visibility control of each timeframe overlay. Visual customization options include adjustable font sizes for toggle buttons and configurable bullish/bearish candle colors with transparency settings to maintain chart clarity. This facilitates a streamlined, interactive top-down market perspective suitable for various markets including Forex, indices, commodities, stocks, and cryptocurrencies.
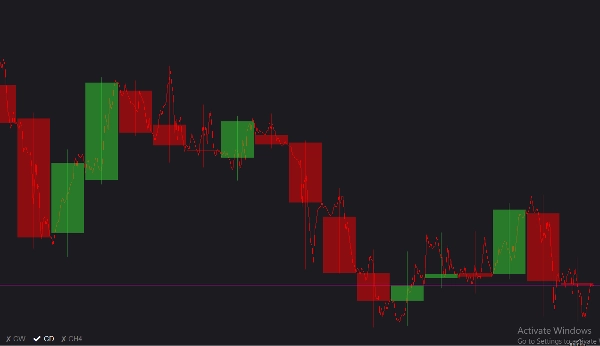
指标配置
客户评价
0.0
评价:0
客户评价
该产品尚无评价。已经试过了?抢先告诉其他人!
讨论
常见问答
BTCUSD
Forex
Indices
EURUSD
Commodities
GBPUSD
NZDUSD
Crypto
Stocks
XAUUSD
NAS100
USDJPY
cTrader Store 提供的所有产品,包括交易机器人、指标和插件,均由第三方开发者提供,仅供信息参考和技术访问之用。cTrader Store 并非经纪商,不提供投资建议、个人推荐或任何未来业绩保证。
该作者的其他作品


价格
注册日期 12/06/2025
1
销售
336
免费安装