Descrição
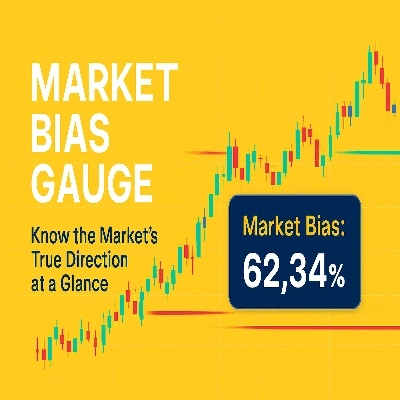
Indicador de Medidor de Tendência do Mercado
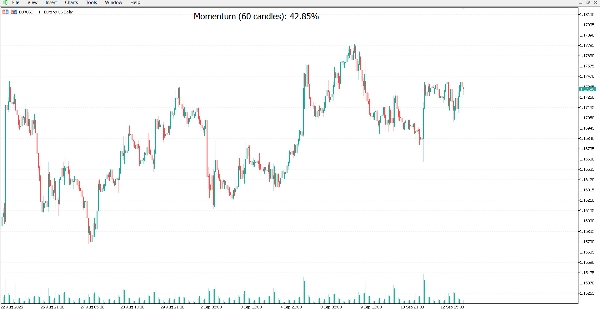
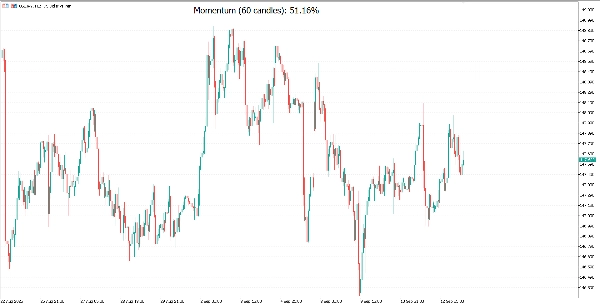
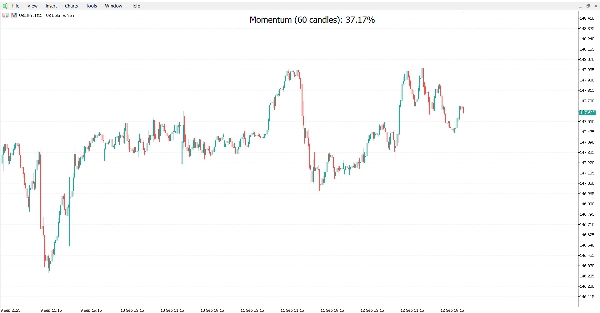
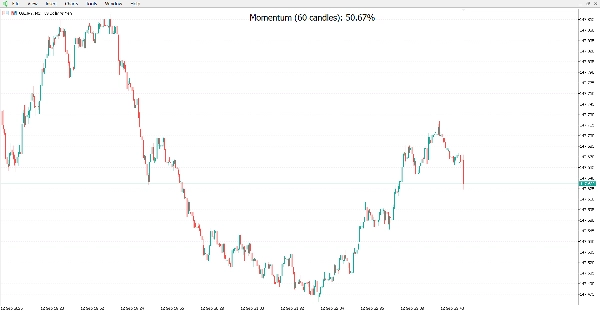
O Medidor de Tendência do Mercado é uma ferramenta de análise técnica projetada para fornecer aos traders uma visão instantânea e clara do momentum do mercado, diretamente no seu gráfico. Em vez de configurações complexas ou indicadores sobrecarregados, esta ferramenta oferece uma métrica única e poderosa: a porcentagem de movimento altista versus baixista no período escolhido.
Objetivo da Ferramenta:
Esta ferramenta tem como objetivo ajudá-lo a avaliar instantaneamente se os compradores ou vendedores estão no controle, o que pode auxiliá-lo a tomar decisões de negociação mais rápidas e confiantes.
Como Ler a Porcentagem de Momentum:
Abaixo de 50%: Indica que o momentum baixista domina. Os vendedores são mais fortes que os compradores no período selecionado, e a tendência do mercado é para baixo.
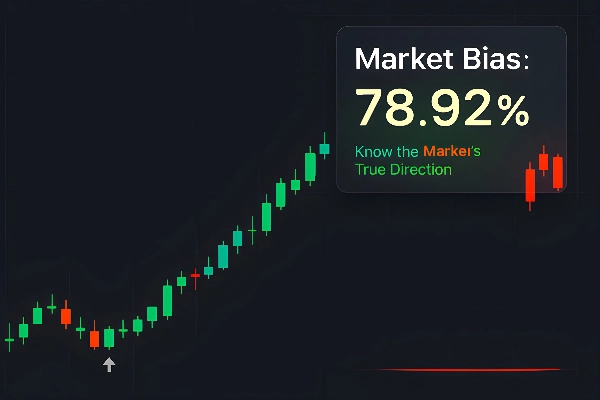
Acima de 50%: Indica que o momentum altista domina. Os compradores são mais fortes que os vendedores no período selecionado, e a tendência do mercado é para cima.
Exatamente 50%: Indica que o mercado está equilibrado, sem uma tendência direcional clara.
Características:
Leitura Instantânea do Momentum: Calcula a porcentagem de mudanças de preço para cima versus para baixo nas últimas velas (padrão: 60).
Exibição Clara no Gráfico: Mostra o valor do momentum em texto grande e legível, perfeitamente centralizado no seu gráfico.
Visual Totalmente Personalizável: Escolha sua fonte, tamanho e cor preferidos para combinar com seu estilo de negociação.
Detecção de Mercado Neutro: Exibe uma leitura equilibrada de 50% quando o mercado não apresenta movimento líquido.
Leve e Rápido: Funciona suavemente em qualquer gráfico, mesmo com grandes conjuntos de dados ou negociação ao vivo.
Atualizações Dinâmicas: Atualiza automaticamente a cada nova vela, mantendo você sincronizado com o mercado.
Por Que os Traders Podem Gostar:
Sem Adivinhações: Veja a tendência do mercado em um único olhar.
Melhor Temporização: Identifique mudanças no momentum antes que apareçam em indicadores tradicionais.
Companheiro Perfeito: Funciona junto com sua estratégia existente sem adicionar desordem ao gráfico.
Aviso Legal
O Medidor de Tendência do Mercado é uma ferramenta de análise técnica destinada apenas a fins informativos e analíticos. Esta ferramenta não fornece aconselhamento financeiro ou de investimento e não garante lucros. Negociar nos mercados financeiros envolve riscos significativos e pode resultar na perda do seu capital. Você é o único responsável por suas decisões de investimento. Deve usar esta ferramenta como parte de uma estratégia de negociação abrangente que inclua gerenciamento de risco.
Resumo
Avaliações de clientes
5 | 0 % | |
4 | 100 % | |
3 | 0 % | |
2 | 0 % | |
1 | 0 % |