
Description
Le Wyckoff Schematic Indicator est un outil professionnel de structure de marché conçu pour détecter et visualiser automatiquement les phases d'accumulation et de distribution Wyckoff directement sur le graphique.
Basé sur les principes de la méthode Wyckoff, cet indicateur identifie les événements institutionnels clés tels que Selling Climax (SC), Automatic Rally (AR), Spring, Sign of Strength (SOS), Buying Climax (BC), Upthrust (UTAD) et plus encore — aidant les traders à comprendre le comportement des smart money en temps réel.
Contrairement aux indicateurs traditionnels, cet outil ne repose pas sur des signaux retardés mais se concentre plutôt sur la structure des prix, le comportement du volume et la volatilité, offrant une compréhension plus approfondie de la dynamique du marché.
Concept Fondamental
L'indicateur est basé sur l'idée que les marchés évoluent à travers des cycles structurés :
- Accumulation → Markup → Distribution → Markdown
Il détecte et visualise automatiquement :
- Les plages de marché
- Les phases Wyckoff (A–E)
- Les événements institutionnels clés
- Les ruptures structurelles et fausses cassures
Caractéristiques Principales
1. Détection Automatique des Phases Wyckoff
L'indicateur identifie toutes les phases majeures du cycle Wyckoff :
- Phase A – Arrêt de la tendance
- Phase B – Construction d'une cause (formation de plage)
- Phase C – Spring / UTAD (fausse cassure)
- Phase D – Confirmation de la tendance (SOS / SOW)
- Phase E – Poursuite de la tendance
Chaque phase est visuellement mise en évidence avec des couleurs personnalisables pour une reconnaissance instantanée.
2. Reconnaissance Intelligente des Événements
Le système détecte les événements Wyckoff critiques :
Accumulation :
- SC – Selling Climax
- AR – Automatic Rally
- ST – Secondary Test
- Spring – Fausse cassure à la baisse
- SOS – Sign of Strength
- LPS – Last Point of Support
Distribution :
- BC – Buying Climax
- AR – Automatic Reaction
- ST – Secondary Test
- UTAD – Upthrust After Distribution
- SOW – Sign of Weakness
- LPSY – Last Point of Supply
Ces événements sont tracés directement sur le graphique avec des étiquettes.
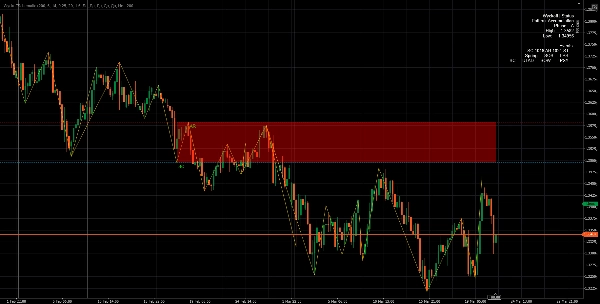
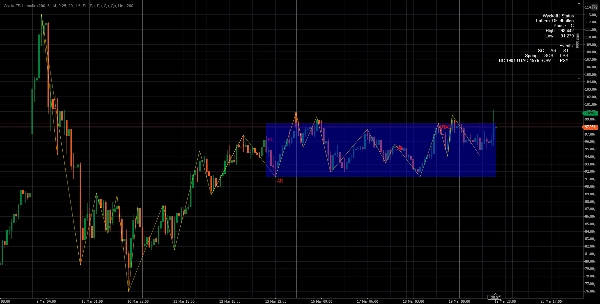
3. Détection Adaptative des Plages
L'indicateur construit et met à jour dynamiquement les plages de trading :
- Détecte automatiquement les plus hauts et plus bas de plage
- Ajuste les limites en utilisant la tolérance basée sur l'ATR
- Affiche les zones de support et de résistance
Cela permet aux traders de voir clairement où le marché accumule ou distribue.
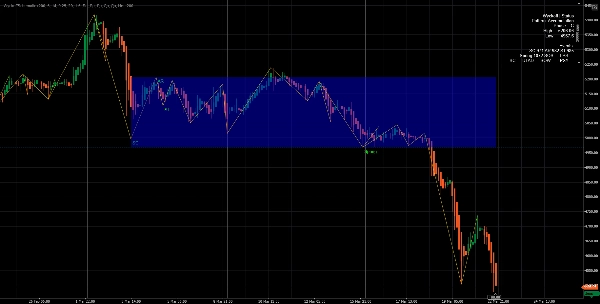
4. Moteur de Structure ZigZag
Un système ZigZag basé sur les pivots intégré :
- Filtre le bruit du marché
- Met en évidence les vrais plus hauts et plus bas structurels
- Assure une reconnaissance précise des motifs
Ceci est essentiel pour identifier de manière fiable les structures Wyckoff.
5. Intégration Volume & Volatilité
L'indicateur utilise :
- Moyenne Mobile du Volume
- Détection des pics de volume
- ATR (Average True Range)
Cela lui permet de :
- Confirmer l'activité institutionnelle
- Filtrer les faux signaux
- Améliorer la précision des événements comme SC, BC, Spring, UTAD
6. Logique de Machine à États en Temps Réel
Au cœur, l'indicateur exécute un algorithme de machine à états qui :
- Suit l'évolution de la structure du marché
- Effectue les transitions entre phases (A → E)
- Empêche les signaux en double
- Maintient le contexte (Accumulation vs Distribution)
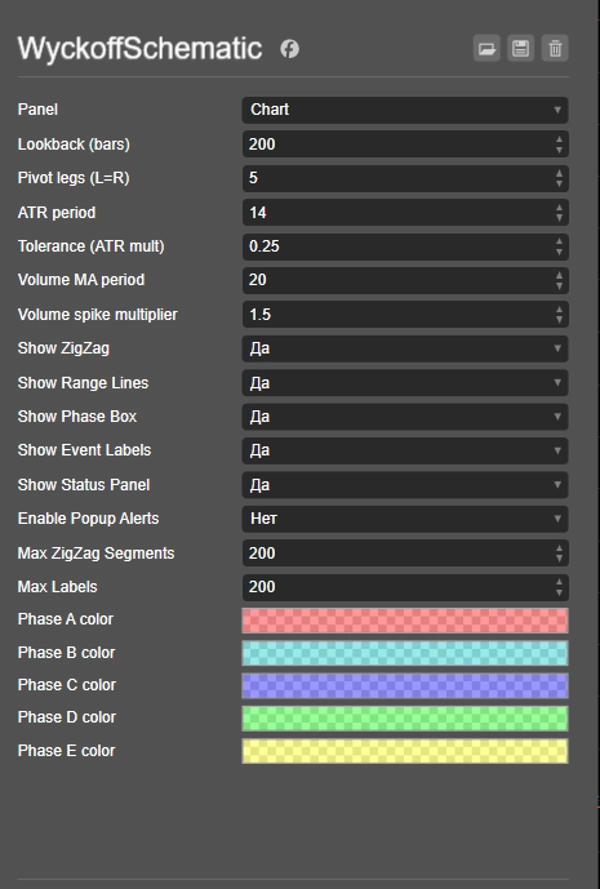
7. Composants Visuels
L'indicateur fournit un ensemble complet d'outils visuels :
- ✔ Boîtes de mise en évidence des phases
- ✔ Lignes des plus hauts/bas de plage
- ✔ Lignes de structure ZigZag
- ✔ Étiquettes d'événements sur le graphique
- ✔ Panneau d'état en temps réel
8. Panneau d'État (Aperçu du Marché en Direct)
Un panneau intégré affiche :
- Le motif actuel (Accumulation / Distribution)
- La phase actuelle (A–E)
- Les limites de plage
- Les événements détectés
Cela offre aux traders une vue instantanée des conditions du marché.
9. Système d'Alerte
Des alertes popup optionnelles vous notifient lorsque des événements clés se produisent :
- SC, BC, Spring, UTAD, SOS, SOW, etc.
Parfait pour surveiller plusieurs marchés.
Avantages
✔ Perspective Smart Money
Contrairement aux indicateurs courants, cet outil suit la logique institutionnelle, pas les indicateurs de détail.
✔ Détection Précoce des Signaux
Identifie l'accumulation/la distribution avant les cassures, permettant :
- Des entrées précoces
- De meilleures configurations risque/rendement
✔ Réduction du Bruit
En utilisant les pivots, l'ATR et les filtres de volume, l'indicateur évite :
- Les signaux aléatoires
- Le bruit du marché
- Les fausses cassures
✔ Analyse Wyckoff Entièrement Automatisée
Pas besoin de marquer manuellement :
- Les phases
- Les événements
- Les plages
Tout est détecté automatiquement.
✔ Hautement Personnalisable
Vous pouvez ajuster :
- La période de retour en arrière
- La sensibilité des pivots
- La tolérance ATR
- La sensibilité au volume
- Les éléments visuels (étiquettes, boîtes, lignes)
✔ Optimisé pour la Performance
- Utilise une analyse en fenêtre glissante
- Limite les objets de dessin
- Efficace pour le trading en temps réel
Paramètres d'Entrée
Structure & Sensibilité
- Barres de retour en arrière – plage d'analyse
- Jambes de pivot – sensibilité de détection des oscillations
Volatilité & Tolérance
- Période ATR
- Multiplicateur ATR (Tolérance)
Analyse du Volume
- Période MA du Volume
- Multiplicateur de pic de volume
Visualisation
- Afficher ZigZag
- Afficher les lignes de plage
- Afficher la boîte de phase
- Afficher les étiquettes d'événements
- Afficher le panneau d'état
Alertes
- Activer les notifications popup
Comment ça fonctionne (simplifié)
- Détecte les plus hauts/bas de pivot (structure du marché)
- Détermine le contexte de tendance (tendance haussière / baissière)
- Recherche des pics de volume + conditions structurelles
- Initialise le motif Wyckoff (Accumulation/Distribution)
- Suit les événements et phases étape par étape
- Met à jour les visuels du graphique en temps réel
Meilleures Utilisations
- Trading smart money / Wyckoff
- Trading de cassure
- Trading en plage
- Détection de retournement
- Analyse du flux d'ordres institutionnels
Conclusion
Le Wyckoff Schematic Indicator est un outil analytique puissant qui transforme la théorie complexe de Wyckoff en un système de trading entièrement automatisé, visuel et exploitable.
Il permet aux traders de :
- Comprendre l'intention du marché
- Identifier des configurations à haute probabilité
- Trader en accord avec le comportement institutionnel
Résumé
Avis clients
5 | 100 % | |
4 | 0 % | |
3 | 0 % | |
2 | 0 % | |
1 | 0 % |


