
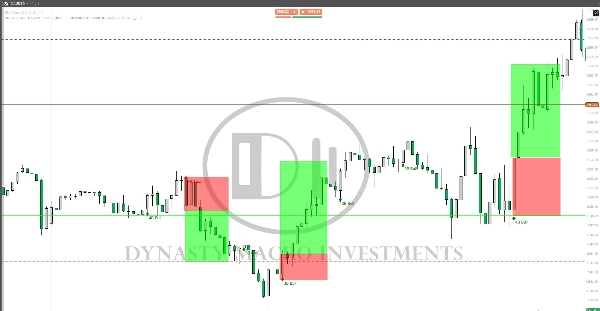
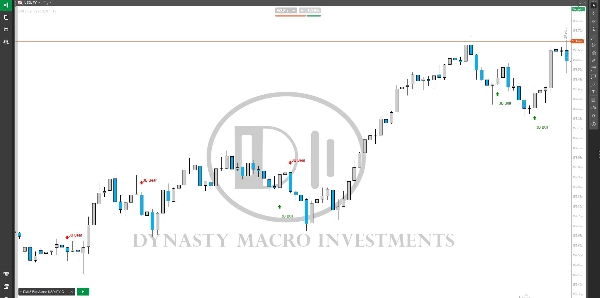
Morning Star On Chart
Indikator
Version 1.0, Dec 2024
Windows, Mac
4.0
Bewertungen: 1
Beschreibung
Morning-Star-Muster im Chart (bullisch und bärisch) automatisch mit (KAUF & VERKAUF) markiert. Sehr starke Signale.
Zusammenfassung
Indikatorprofil
Kundenbewertungen
4.0
Bewertungen: 1
5 | 0 % | |
4 | 100 % | |
3 | 0 % | |
2 | 0 % | |
1 | 0 % |
Diskussion
Häufig gestellte Fragen (FAQ)
Über den cTrader Store verfügbare Produkte, einschließlich Handelsbots, Indikatoren und Plugins, werden von externen Entwicklern bereitgestellt und nur zu Informations- und technischen Zugriffszwecken verfügbar gemacht. cTrader Store ist kein Broker und erbringt keine Anlageberatung, persönlichen Empfehlungen oder eine Garantie für zukünftige Performance.
Mehr von diesem Autor


Preis
2
Verkäufe