
WaveWeisBarForce
Wskaźnik
169 pobrania
Wersja 1.0, Dec 2025
Windows, Mac
5.0
Opinie: 2
Opis
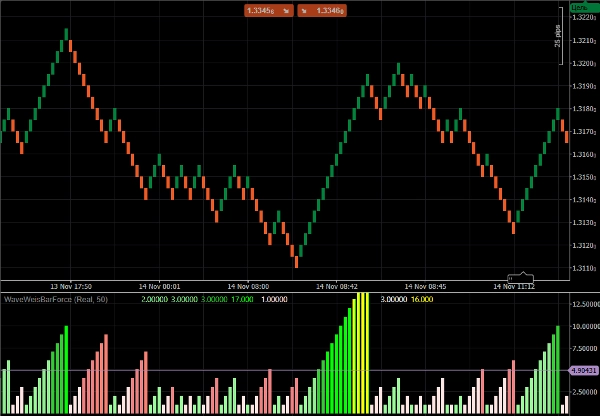
Wave Weis Bar Force - to wskaźnik, który stosuje logikę fal wolumenu (Weis) do określania akumulacji i zmian kierunku rynku.
Podsumowuje wolumen, dopóki trend pozostaje niezmieniony. Gdy kierunek się zmienia, zaczyna się nowa fala, a akumulacja jest resetowana.
Intensywność jest obliczana według poziomów, na podstawie stosunku między wolumenem bieżącej fali a największą ostatnią akumulacją. Służy jako dodatkowy filtr i dobrze sprawdza się w strategiach trendowych.
Podsumowanie
Podsumowanie AI
Wave Weis Bar Force is a technical indicator that applies the concept of Volume Waves (Weis) to identify market accumulation phases and detect changes in market direction. It aggregates volume data while the current trend persists, resetting accumulation when a new wave begins with a trend reversal. The indicator calculates intensity levels based on the ratio of the current wave's volume to the largest recent accumulation, providing a quantitative measure of volume strength. This functionality serves as an additional filter and is particularly useful in trending market strategies. The indicator supports analysis across multiple markets including Forex, Crypto, and Stocks, and is applicable to trading approaches such as breakout and scalping strategies.
Profil wskaźnika
Opinie klientów
5.0
Opinie: 2
5 | 100 % | |
4 | 0 % | |
3 | 0 % | |
2 | 0 % | |
1 | 0 % |
Opinie klientów
December 10, 2025
WaveWeisBarForce blends Weis Wave logic with bar-strength analysis to show real buying/selling force. Clean histogram, stable performance, great for confirming impulses and spotting exhaustion. Useful for Wyckoff, VSA and intraday momentum traders.
Dyskusja
Częste pytania
Forex
Breakout
Scalping
Crypto
Stocks
Produkty dostępne za pośrednictwem cTrader Store, w tym boty handlowe, wskaźniki i wtyczki, dostarczane są przez deweloperów zewnętrznych i udostępniane wyłącznie w celach informacyjnych oraz w celu zapewnienia dostępu technicznego. cTrader Store nie jest brokerem i nie zapewnia doradztwa inwestycyjnego, nie udziela spersonalizowanych rekomendacji ani nie gwarantuje przyszłych wyników.
Więcej od tego autora


![Logo „Gaussian Channel [Iridio Capital]”](https://cdn.ctrader.com/image/webp/7c039209-5573-4a54-a072-f9528b503103_41960)


Cena
Od 24/10/2025
1.43M
Wolumen transakcji
4.79K
Zysk w pipsach
2
Sprzedaż
317
Bezpłatne instalacje