
설명
The Wyckoff Schematic Indicator는 차트에서 직접 Wyckoff 축적 및 분배 단계를 자동으로 감지하고 시각화하도록 설계된 전문가급 시장 구조 도구입니다.
이 지표는 Wyckoff 방법의 원칙에 기반하여 판매 절정(SC), 자동 반등(AR), 스프링, 강세 신호(SOS), 매수 절정(BC), 업스트러스트(UTAD) 등 주요 기관 이벤트를 식별하여 트레이더가 실시간으로 스마트 머니 행동을 이해하는 데 도움을 줍니다.
기존 지표와 달리 이 도구는 후행 신호에 의존하지 않고 가격 구조, 거래량 행동 및 변동성에 집중하여 시장 역학에 대한 더 깊은 통찰을 제공합니다.
핵심 개념
이 지표는 시장이 구조화된 사이클을 통해 움직인다는 아이디어에 기반합니다:
- 축적 → 마크업 → 분배 → 마크다운
자동으로 감지하고 시각화합니다:
- 시장 범위
- Wyckoff 단계 (A–E)
- 주요 기관 이벤트
- 구조적 돌파 및 페이크아웃
주요 특징
1. 자동 Wyckoff 단계 감지
이 지표는 Wyckoff 사이클의 모든 주요 단계를 식별합니다:
- 단계 A – 추세 중단
- 단계 B – 원인 구축 (범위 형성)
- 단계 C – 스프링 / UTAD (가짜 돌파)
- 단계 D – 추세 확인 (SOS / SOW)
- 단계 E – 추세 지속
각 단계는 즉시 인식할 수 있도록 사용자 지정 가능한 색상으로 시각적으로 강조됩니다.
2. 스마트 이벤트 인식
시스템은 중요한 Wyckoff 이벤트를 감지합니다:
축적:
- SC – 판매 절정
- AR – 자동 반등
- ST – 2차 테스트
- 스프링 – 가짜 하락 돌파
- SOS – 강세 신호
- LPS – 마지막 지지점
분배:
- BC – 매수 절정
- AR – 자동 반응
- ST – 2차 테스트
- UTAD – 분배 후 업스트러스트
- SOW – 약세 신호
- LPSY – 마지막 공급점
이 이벤트들은 차트에 라벨과 함께 직접 표시됩니다.
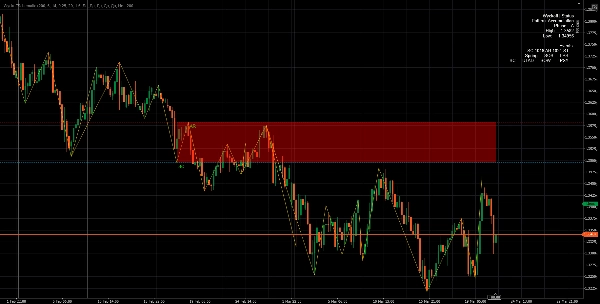
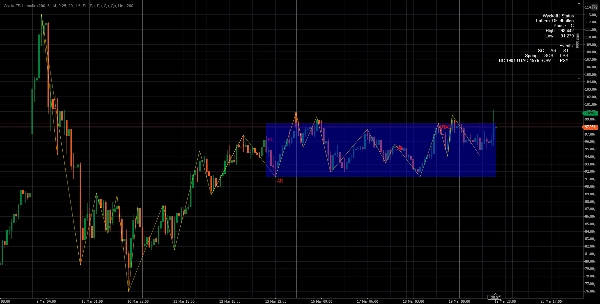
3. 적응형 범위 감지
이 지표는 거래 범위를 동적으로 구축하고 업데이트합니다:
- 자동으로 범위 최고점과 최저점을 감지합니다
- ATR 기반 허용 오차를 사용하여 경계를 조정합니다
- 지지 및 저항 구역을 표시합니다
이를 통해 트레이더는 시장이 어디에서 축적 또는 분배되고 있는지 명확히 볼 수 있습니다.
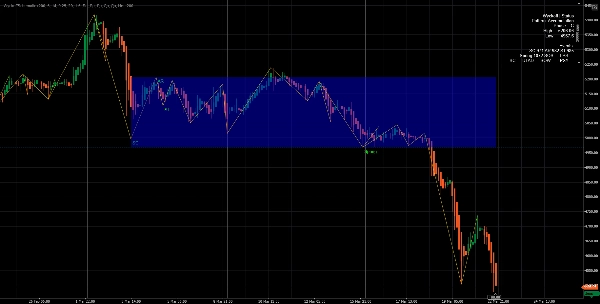
4. ZigZag 구조 엔진
내장된 피벗 기반 ZigZag 시스템:
- 시장 노이즈를 필터링합니다
- 진정한 구조적 최고점과 최저점을 강조합니다
- 정확한 패턴 인식을 보장합니다
이는 Wyckoff 구조를 신뢰성 있게 식별하는 데 필수적입니다.
5. 거래량 및 변동성 통합
이 지표는 다음을 사용합니다:
- 거래량 이동평균
- 거래량 급증 감지
- ATR (평균 진폭 범위)
이를 통해 다음을 수행할 수 있습니다:
- 기관 활동을 확인합니다
- 가짜 신호를 필터링합니다
- SC, BC, 스프링, UTAD와 같은 이벤트의 정확도를 향상시킵니다
6. 실시간 상태 기계 로직
이 지표의 핵심은 상태 기계 알고리즘으로, 다음을 수행합니다:
- 시장 구조의 진화를 추적합니다
- 단계 간 전환을 관리합니다 (A → E)
- 중복 신호를 방지합니다
- 맥락을 유지합니다 (축적 대 분배)
7. 시각적 구성 요소
이 지표는 완전한 시각적 도구 키트를 제공합니다:
- ✔ 단계 강조 박스
- ✔ 범위 최고/최저선
- ✔ ZigZag 구조선
- ✔ 차트상의 이벤트 라벨
- ✔ 실시간 상태 패널
8. 상태 패널 (실시간 시장 인사이트)
내장된 패널은 다음을 표시합니다:
- 현재 패턴 (축적 / 분배)
- 현재 단계 (A–E)
- 범위 경계
- 감지된 이벤트
이를 통해 트레이더는 시장 상황을 즉시 파악할 수 있습니다.
9. 알림 시스템
선택적 팝업 알림은 주요 이벤트 발생 시 알려줍니다:
- SC, BC, 스프링, UTAD, SOS, SOW 등
여러 시장을 모니터링하는 데 적합합니다.
장점
✔ 스마트 머니 관점
일반 지표와 달리 이 도구는 기관 논리를 따르며, 소매 지표가 아닙니다.
✔ 조기 신호 감지
돌파 전에 축적/분배를 식별하여 다음을 가능하게 합니다:
- 조기 진입
- 더 나은 위험/보상 설정
✔ 노이즈 감소
피벗, ATR, 거래량 필터를 사용하여 이 지표는 다음을 피합니다:
- 무작위 신호
- 시장 노이즈
- 가짜 돌파
✔ 완전 자동 Wyckoff 분석
수동으로 표시할 필요가 없습니다:
- 단계
- 이벤트
- 범위
모든 것이 자동으로 감지됩니다.
✔ 높은 사용자 정의 가능성
다음 항목을 조정할 수 있습니다:
- 조회 기간
- 피벗 민감도
- ATR 허용 오차
- 거래량 민감도
- 시각적 요소 (라벨, 박스, 선)
✔ 성능 최적화
- 슬라이딩 윈도우 분석 사용
- 그리기 객체 제한
- 실시간 거래에 효율적
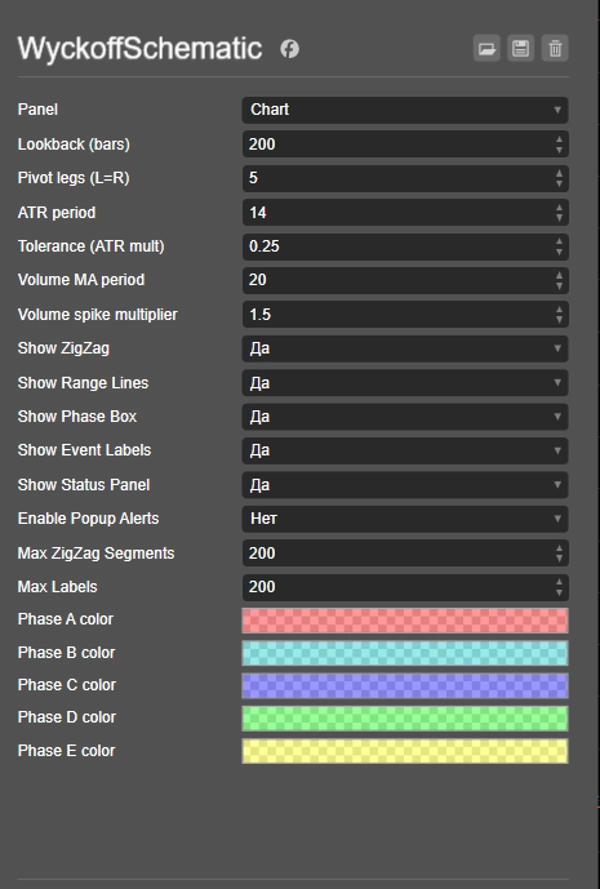
입력 매개변수
구조 및 민감도
- 조회 바 – 분석 범위
- 피벗 레그 – 스윙 감지 민감도
변동성 및 허용 오차
- ATR 기간
- ATR 배수 (허용 오차)
거래량 분석
- 거래량 MA 기간
- 거래량 급증 배수
시각화
- ZigZag 표시
- 범위선 표시
- 단계 박스 표시
- 이벤트 라벨 표시
- 상태 패널 표시
알림
- 팝업 알림 활성화
작동 방식 (단순화)
- 피벗 최고점/최저점 감지 (시장 구조)
- 추세 맥락 결정 (상승 추세 / 하락 추세)
- 거래량 급증 + 구조적 조건 탐색
- Wyckoff 패턴 초기화 (축적/분배)
- 이벤트 및 단계를 단계별로 추적
- 차트 시각 요소를 실시간으로 업데이트
최적 사용 사례
- 스마트 머니 / Wyckoff 트레이딩
- 돌파 트레이딩
- 범위 트레이딩
- 반전 감지
- 기관 주문 흐름 분석
결론
The Wyckoff Schematic Indicator는 복잡한 Wyckoff 이론을 완전 자동화되고 시각적이며 실행 가능한 트레이딩 시스템으로 변환하는 강력한 분석 도구입니다.
트레이더가 다음을 할 수 있게 합니다:
- 시장 의도를 이해합니다
- 높은 확률의 설정을 식별합니다
- 기관 행동과 일치하여 거래합니다
요약
고객 리뷰
5 | 100 % | |
4 | 0 % | |
3 | 0 % | |
2 | 0 % | |
1 | 0 % |


