present
Zarejestruj się i otrzymaj 50 $ zniżki na pierwszy zakup
Trading product for Volume Profile HD Wskaźnik Breakout Scalping, image 1
Volume Profile HD
Wskaźnik
Wersja 1.1, Apr 2026
Windows, Mac
4.0
Opinie: 3
Trading product for Volume Profile HD Wskaźnik Breakout Scalping, image 2
Trading product for Volume Profile HD Wskaźnik Breakout Scalping, image 3
Trading product for Volume Profile HD Wskaźnik Breakout Scalping, image 4
Trading product for Volume Profile HD Wskaźnik Breakout Scalping, image 5
Od 09/05/2025
5
Sprzedaż

Opis

Pełny opis produktu

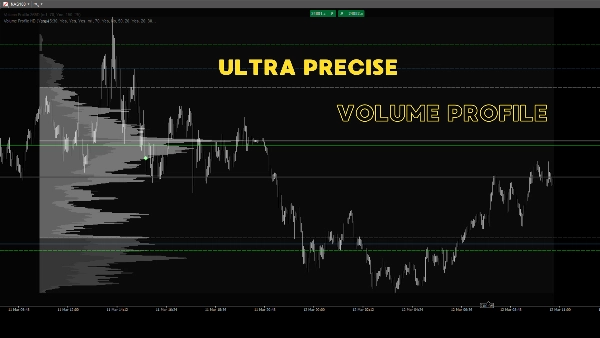
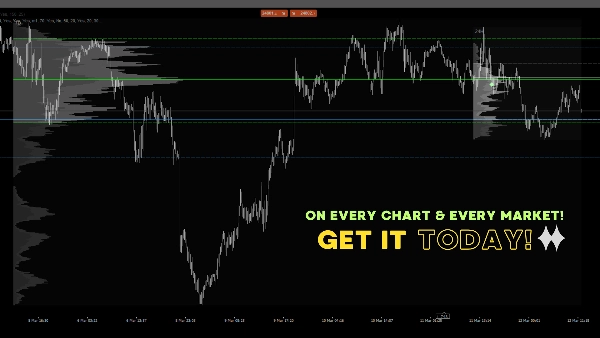
Podnieś swój trading dzięki Rolling Volume Profile MTF, profesjonalnemu wskaźnikowi zaprojektowanemu specjalnie dla cTrader. To narzędzie dostarcza głębokich informacji o strukturze rynku, wyświetlając dynamiczne, przesuwające się profile wolumenu bezpośrednio na wykresie.

Zamiast polegać na stałych dziennych profilach, ten wskaźnik ciągle oblicza rozkład wolumenu za ostatnie 24 godziny, 7 dni i 30 dni. Daje to ogromną przewagę w identyfikacji prawdziwych poziomów wsparcia/oporu intraday i swing, opartych na faktycznym wolumenie transakcji, a nie tylko na ruchu cen.

🔥 Kluczowe cechy:

  • 3 przesuwające się profile: Jednoczesne wyświetlanie rozkładów wolumenu 24H, 7D i 30D w jednym przejrzystym widoku.
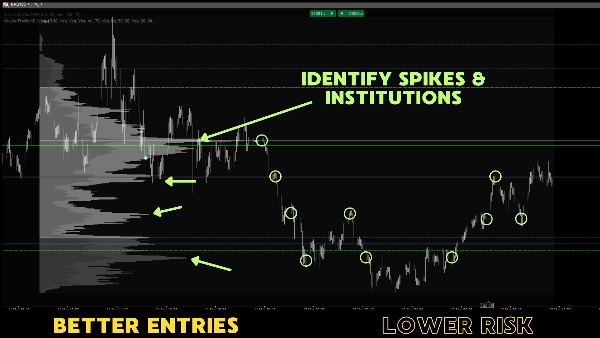
  • Podstawowe poziomy wolumenu: Automatyczne obliczanie i wyświetlanie Punktu Kontroli (POC), Wartości Obszaru Wysokiego (VAH) oraz Wartości Obszaru Niskiego (VAL) dla każdego profilu.
  • Rozszerzone linie wartości: Opcja projekcji linii POC, VAH i VAL w przyszłość, aby przewidzieć nadchodzące reakcje.
  • Precyzyjny znacznik otwarcia NY: Automatyczne umieszczenie wyraźnego znacznika (diamentu) na dokładnej cenie otwarcia sesji nowojorskiej. Idealne do strategii Initial Balance i opartych na sesjach.
  • Precyzja wieloczasowa: Wykorzystuje szczegółowe dane z niższych interwałów czasowych (np. słupki 1-minutowe) do tworzenia bardzo dokładnych profili na wykresach wyższych interwałów.
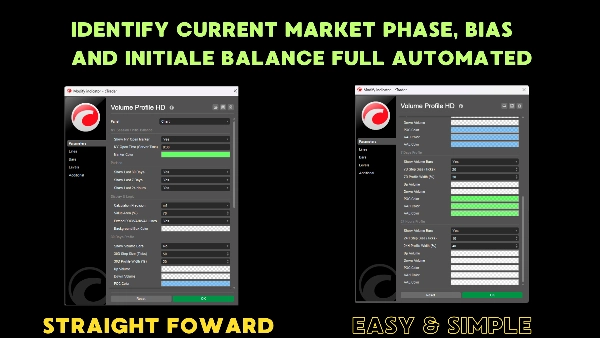
  • W pełni konfigurowalny: Dostosuj kroki ticków, szerokości profili, procenty obszaru wartości (domyślnie 70%) oraz kolory dla wolumenu wzrostowego/spadkowego i tła.

💡 Dlaczego warto używać tego wskaźnika?
Traderzy instytucjonalni polegają na wolumenie i obszarach wartości, aby znaleźć uczciwe ceny i pule płynności. Wizualizując, gdzie najwięcej wolumenu zostało zrealizowane w określonych okresach przesuwających się, łatwo można zauważyć strefy wysokiego prawdopodobieństwa wybicia, odbicia i odwrócenia. Zintegrowany znacznik otwarcia NY zapewnia, że nigdy nie stracisz z oczu najważniejszej ceny odniesienia intraday.

Idealny dla day traderów, skalperów, traderów futures/forex oraz każdego, kto szuka instytucjonalnej przewagi w analizie wykresów.

Podsumowanie

Podsumowanie AI
Volume Profile HD is a multi-timeframe rolling volume profile indicator designed for the cTrader platform. It continuously calculates and displays dynamic volume distributions over the last 24 hours, 7 days, and 30 days, providing traders with detailed insights into market structure based on actual traded volume. The indicator automatically plots key volume levels including the Point of Control (POC), Value Area High (VAH), and Value Area Low (VAL) for each profile, with an option to extend these levels forward to anticipate future price reactions.

A precise New York Session open price marker is included, aiding session-based and initial balance strategies. The indicator builds highly accurate profiles by utilizing granular lower-timeframe data, such as 1-minute bars, on any higher timeframe chart. Customization options allow adjustment of tick step sizes, profile widths, value area percentages, and color schemes for bullish and bearish volumes and background boxes.

This tool is suitable for day traders, scalpers, futures, and forex traders seeking to identify institutional volume levels, support and resistance zones, and high-probability breakout or reversal areas. Supported markets include indices and symbols like NAS100 and XAUUSD.
Profil wskaźnika

Opinie klientów

4.0
Opinie: 3
5
0 %
4
100 %
3
0 %
2
0 %
1
0 %
Opinie klientów
March 23, 2026
fits a trader who wants less noise in the process. The best use is checking participation and pressure, then leaving the final filter manual.
March 21, 2026
Tbh the value is mostly in filtering bad ideas. I still would not trust it live without checking the chart myself. A cautious first pass gives a cleaner opinion.
March 14, 2026
For volume based context, the practical question is whether it reduces bad decisions. A 62 setup journal on New York open makes that clearer.

Dyskusja

Częste pytania

Breakout
Scalping
Indices
Fair Value Gap
SMC
XAUUSD
NAS100
Produkty dostępne za pośrednictwem cTrader Store, w tym boty handlowe, wskaźniki i wtyczki, dostarczane są przez deweloperów zewnętrznych i udostępniane wyłącznie w celach informacyjnych oraz w celu zapewnienia dostępu technicznego. cTrader Store nie jest brokerem i nie zapewnia doradztwa inwestycyjnego, nie udziela spersonalizowanych rekomendacji ani nie gwarantuje przyszłych wyników.

Więcej od tego autora

Wskaźnik
SMC
Prop
+17
Unlock the true intent of market participants with the Classic Proportional Cumulative Volume Delta CVD!
Wskaźnik
SMC
NAS100
+5
Detects extreme trading volume using dynamic percentiles and plots bullish/bearish clusters directly on your chart.

Możesz także polubić

Wskaźnik
Prop
Forex
+10
IBS Indicator – Measures price position within bars for smarter trades. Works on all markets & timeframes.
Wskaźnik
Signal
Dark Poll Signal Indicator.liquidity leakage,precedes the great movement, accumulation, distribution
Wskaźnik
Forex
Real-Time Candlestick Pattern Detection with Custom Alerts & Trend Analysis for cTrader
Wskaźnik
ATR
EMA
+5
The indicator displays potential reversal zones (support/resistance) on the chart based on the average range (High–Low)
Wskaźnik
BOS
EMA
+5
Directional volume heatmap: see if a price zone was built on buying or selling, not just how much.
Logo „Oscillator Scanner”
Najwyżej oceniane
4.7
(4)
$20
/
$39
Wskaźnik
ATR
RSI
+7
Track the Movement of Market Assets with an Oscillator Scanner in Real-Time!
Wskaźnik
Forex
BTCUSD
+10
Enhance trading with TSI! Use the True Strength Index for clear insights into market momentum and trend strength.
Wskaźnik
ATR
RSI
+3
🚀 Specialized algorithm is designed to confirm entry and exit points with precision 🎯
Wskaźnik
The Multi-Timeframe Candle Indicator displays candles from multiple timeframes in one window, enhancing market analysis!
Wskaźnik
RSI
BTCUSD
+5
Identify market structure effortlessly with swing highs, lows, CHoCH, and BOS levels for smart trading decisions! 📊🔍"
Wskaźnik
RSI
Forex
+4
😎Read the description before purchasing💩
Logo „UT Bot”
Popularne
4.4
(5)
$19
/
$20
Wskaźnik
ATR
Forex
+11
Trend-following indicator with dynamic ATR-based trailing stop for precise entry/exit signals
Wskaźnik
VWAP
NAS100
+5
Key NY session opens for NASDAQ (US100) & SP500 to find Tick Precise Entrys for High R:R intraday setups.
Logo „Vwap Bands”
Najwyżej oceniane
4.5
(4)
$19
/
$29
Wskaźnik
VWAP
Moving Average
Vwap Bands it is highly sought after by professional traders because it includes Standard Deviation Bands
Wskaźnik
XAUUSD
Professional Volume Profile Indicator - Shows volume distribution, POC, Value Areas & Buy/Sell pressure.
Wskaźnik
BOS
CHOCH
+5
MyZTrade High TF candle is a multi-timeframe visualisation tool that overlays completed higher-timeframe candles.
Wskaźnik
EMA
A visual signal backtester that simulates trades directly on your chart and scores strategy performance.
Wskaźnik
Shows daily and sessions highs / lows and session boxes, everything configurable

Cena

Od 09/05/2025
5
Sprzedaż