
Descrição
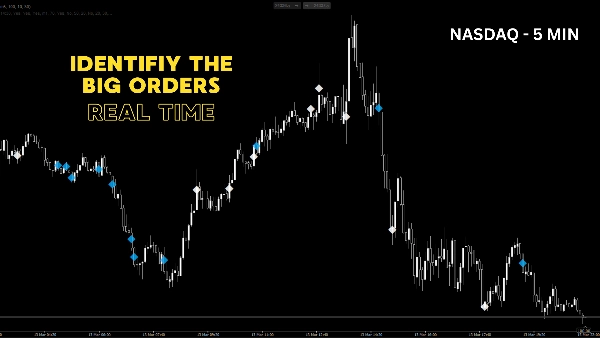
Clusters de Volume Anormais é uma ferramenta de análise de volume de alta precisão para cTrader projetada para revelar pegadas institucionais e atividade extrema de negociação. O volume precede o preço, e este indicador mostra exatamente onde o "dinheiro inteligente" está entrando no mercado.
Em vez de depender de limites fixos e estáticos de volume, este indicador usa uma lógica dinâmica de percentil móvel. Ele analisa o histórico recente e destaca apenas os candles cujo volume é realmente anormal (por exemplo, os 5% maiores volumes nos últimos 200 períodos).
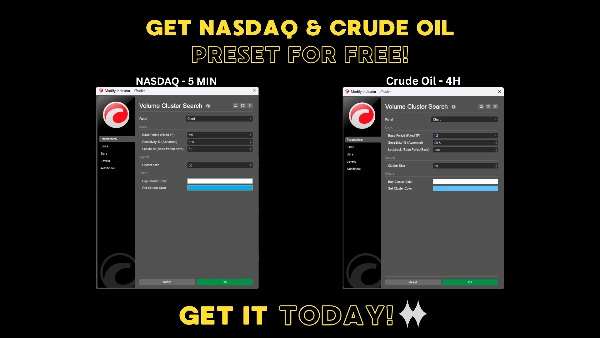
Uma grande vantagem é sua capacidade Multi-Timeframe (MTF): Você pode operar em um gráfico de 5 minutos enquanto o indicador monitora silenciosamente um "Período Base" superior (como o gráfico de 1 hora) para picos de volume, projetando esses clusters cruciais diretamente no seu gráfico de timeframe inferior exatamente onde aconteceram.
🔥 Principais Características:
- Sensibilidade Dinâmica: Usa um limite de percentil móvel (por exemplo, 95%) para que se adapte automaticamente tanto a condições de mercado calmas quanto altamente voláteis.
- Verdadeiro Multi-Timeframe: Filtre o ruído do mercado usando um timeframe base superior, enquanto mantém suas entradas extremamente precisas em timeframes inferiores.
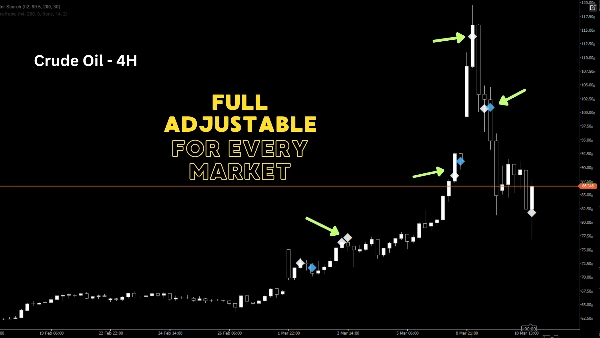
- Clusters Direcionais: Eventos de volume extremo são plotados como marcadores de diamante (◆) exatamente no preço mediano. Verde para fechamentos de alta, Vermelho para fechamentos de baixa.
- Altamente Otimizado: Gerenciamento de memória embutido (máximo de 2000 objetos desenhados) garante que sua plataforma cTrader permaneça extremamente rápida.
- Totalmente Personalizável: Ajuste o período de Lookback, Sensibilidade (%), Timeframe Base, Tamanho do Cluster e Cores para se adequar ao seu estilo pessoal de negociação.
💡 Como usar?
Volume anormal geralmente indica uma de duas coisas: Início massivo de tendência (breakouts) ou capitulação/absorção (reversões). Ao identificar esses clusters, você pode reconhecer zonas ocultas de suporte e resistência baseadas no capital realmente negociado, não apenas na ação do preço. Perfeito para Day Traders, Scalpers, Swing Traders e Traders de Ação de Volume que buscam uma vantagem real.
Resumo
Avaliações de clientes
5 | 0 % | |
4 | 67 % | |
3 | 33 % | |
2 | 0 % | |
1 | 0 % |


