

Açıklama
1️⃣ Bu Gösterge Ne Yapar?
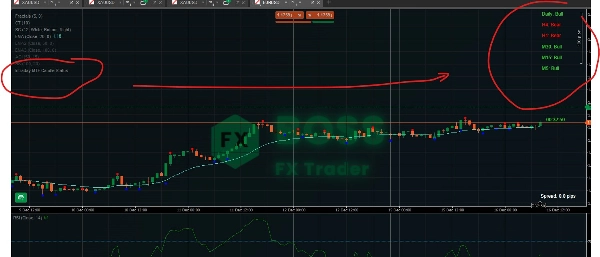
Bu araç birden fazla zaman dilimindeki mum yönünü grafik üzerinde tek bir yerde özetler.
Her zaman dilimi için, son kapanan mumu kontrol eder ve şunları gösterir:
DurumAnlamı
🟢 Boğa
Kapanış > Açılış (alıcılar kontrolü elinde)
🔴 Ayı
Kapanış < Açılış (satıcılar kontrolü elinde)
⚪ Doji
Kapanış ≈ Açılış (kararsızlık)
Gösterilen zaman dilimleri:
- Günlük
- H4
- H1
- M30
- M15
- M5
Tüm durumlar doğrudan grafik üzerinde gösterilir, böylece zaman dilimleri arasında geçiş yapmanıza gerek kalmaz.
2️⃣ Bu Araç Neden Güçlüdür
🔥 Yaygın Bir Trader Sorununu Çözer
Çoğu trader sorar:
“Yüksek zaman dilimi trendiyle uyumlu mi yoksa karşı mı işlem yapıyorum?”
Bu gösterge bunu anında yanıtlar.
Tahmin etmek yerine:
- Trend uyumunu görürsünüz
- Karşı trend girişlerinden kaçınırsınız
- Zamanlama ve güveninizi artırırsınız
3️⃣ Gösterge Nasıl Çalışır
📌 Mum Durumu Mantığı
- Son kapanan mumu kullanır (
Last(1)) - Yeniden boyama yapmaz
- Güvenilir onay
📌 Çoklu Zaman Dilimi Verisi
- Her zaman diliminden gerçek mum verisi alır
- Şu anda bulunduğunuz grafik zaman diliminden bağımsızdır
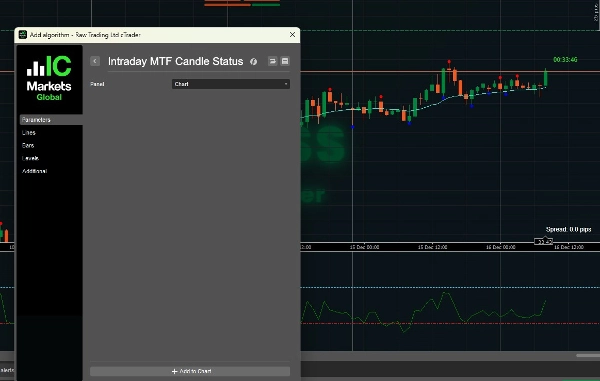
📌 Grafik Üzerinde Gösterim
- Metin etiketlerini sağ üst alana çizer
- Anında okunabilirlik için renk kodlu
- Her tikte güncellenir
4️⃣ Etkili Kullanım (İşlem Senaryoları)
🟢 Senaryo 1: Trend Onayı (En İyi Kullanım)
✔ Kural:
Yalnızca yüksek ve düşük zaman dilimleri uyumlu olduğunda işlem yapın
Örnek:
Günlük: Boğa
H4: Boğa
H1: Boğa
M15: Boğa
M5: Boğa
✅ Yüksek olasılıklı ALIŞ ortamı
Kullanım:
- Geri çekilmeler
- Kırılmalar
- Devam girişleri
❌ Burada SATIŞLARDAN kaçının
🔴 Senaryo 2: Karşı Trend Uyarısı
Günlük: Boğa
H4: Boğa
H1: Ayı
M15: Ayı
M5: Ayı
⚠️ Piyasa bir geri çekilme içinde, dönüş değil.
En iyi hareketler:
- M5/M15'in tekrar Boğa olmasını bekleyin
- SATIŞLARI kovalamaktan kaçının
- Destekte alış düzenleri arayın
⚪ Senaryo 3: Dalgalı / Aralıklı Piyasa
Günlük: Boğa
H4: Doji
H1: Doji
M15: Ayı
M5: Boğa
🚫 Düşük kaliteli koşullar
Önerilen:
- Pozisyon büyüklüğünü azaltın
- Kırılma işlemlerinden kaçının
- Yapı netliği için bekleyin
5️⃣ Scalping Stratejisi Örneği (M5 Girişleri)
🔹 İdeal Alış Düzeni
- Günlük → Boğa
- H4 → Boğa
- H1 → Boğa
- M15 → Boğa
- M5 → Ayı → Boğa'ya döner
📍 Giriş:
- M5 tekrar Boğa olduğunda
- Şunlarla birleştirin:
-
- Destek
- Fraktallar
- EMA / VWAP
🔹 İdeal Satış Düzeni
Ters mantık:
- Yüksek zaman dilimleri → Ayı
- M5 geri çekilme tamamlandığında giriş yapın
6️⃣ En İyi Zaman Dilimi Kombinasyonları
İşlem StiliOdak Zaman Dilimleri
Scalping
H1 → M15 → M5
Gün içi
H4 → H1 → M15
Swing
Günlük → H4 → H1
7️⃣ Bu Araç NEDİR DEĞİLDİR
🚫 Kendi başına bir giriş sinyali değildir
🚫 Bir dönüş göstergesi değildir
🚫 Yapı / fiyat hareketinin yerine geçmez
✅ Bu bir eğilim ve onay aracıdır
8️⃣ Birlikte Kullanılabilecek En İyi Göstergeler
Şiddetle tavsiye edilen eşleştirmeler:
- ✅ Fraktallar (zaten kullanıyorsunuz)
- ✅ Piyasa yapısı (HH / LL)
- ✅ Destek ve Direnç
- ✅ EMA 50 / EMA 200
- ✅ VWAP
9️⃣ Bu Araçla Profesyonel İşlem Kuralları
✔ Yalnızca YTZ yönünde işlem yapın
✔ Giriş zamanlaması için STZ kullanın
✔ Günlük ve H4 uyuşmadığında sinyalleri görmezden gelin
✔ Karışık sinyallerde aşırı işlem yapmayın
✔ Mum eğilimini yapının onaylamasına izin verin
🔟 Son Özet
IntradyMultiTimeframeCandleStatus = Piyasa Eğilimi Paneli
Size şunları sağlar:
- Anında trend netliği
- Daha yüksek olasılıklı işlemler
- Daha az duygusal kararlar
- Daha temiz yürütme
Ürünümüze göz atın.
Özet
Müşteri değerlendirmeleri
5 | 100 % | |
4 | 0 % | |
3 | 0 % | |
2 | 0 % | |
1 | 0 % |


