
Opis
TIB — Wskaźnik Tick Imbalance Bars. Wykrywaj informacje rynkowe przed ruchem ceny
Wersja 2.0
Użyj sekcji komentarzy, aby zapytać o więcej szczegółów
Dostępne sesje wideo z przewodnikiem po ustawieniach po zakupie
Tick Imbalance Bars wprowadza analizę mikrostruktury rynku na poziomie instytucjonalnym do cTrader. Opierając się na przełomowych badaniach Marcos López de Prado, opisanych w jego książce Advances in Financial Machine Learning, ten wskaźnik próbuje dane cenowe nie według czasu czy wolumenu — lecz według napływu informacji.
Główna idea
Tradycyjne świece (czasowe, tickowe, wolumenowe) próbkują rynek równomiernie, pomijając kluczowe momenty, gdy działają świadomi inwestorzy. Tick Imbalance Bars rozwiązują ten problem, wykrywając, kiedy presja kupna lub sprzedaży przekracza oczekiwane poziomy — sygnalizując obecność świadomych inwestorów i potencjalny ruch ceny zanim rynek osiągnie równowagę.
Jak to działa
Wskaźnik stosuje regułę ticka do klasyfikacji każdej transakcji jako presję kupna (+1) lub sprzedaży (-1). Następnie kumuluje te podpisane ticki, aż skumulowana nierównowaga (θT) przekroczy dynamiczny próg obliczany za pomocą wykładniczej średniej ruchomej ważonej (EWMA). Ten oczekiwany próg dostosowuje się do warunków rynkowych, analizując historyczne prawdopodobieństwo ticków kupna vs. sprzedaży. Gdy próg zostanie przekroczony, tworzona jest nowa świeca TIB — każda świeca zawiera mniej więcej równą ilość informacji rynkowej, niezależnie od wolumenu czy upływu czasu.
Kluczowe cechy
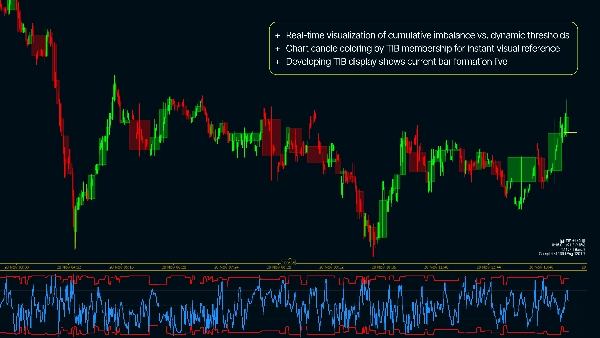
- Wizualizacja w czasie rzeczywistym skumulowanej nierównowagi względem dynamicznych progów
- Kolorowanie świec na wykresie według przynależności do TIB dla natychmiastowej wizualnej orientacji
- Wyświetlanie rozwijającej się świecy TIB pokazujące aktualne formowanie się świecy na żywo
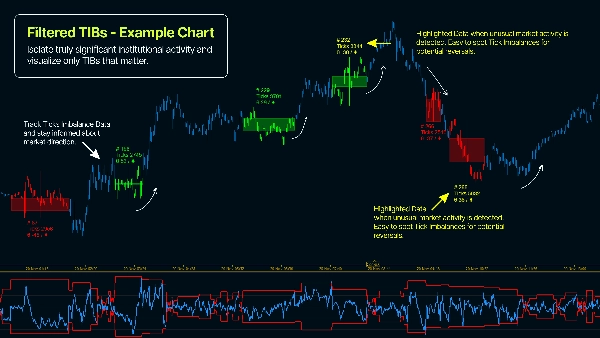
- Filtr Min Ticks do wyświetlania tylko statystycznie istotnych świec
- W pełni konfigurowalny oczekiwany rozmiar świecy i parametry EWMA
- Metryki na pulpicie śledzące intensywność nierównowagi i gęstość informacji
Dlaczego warto używać Tick Imbalance Bars?
- Próbkuj częściej podczas okresów wysokiej informacji — uchwyć użyteczną zmienność
- Wykrywaj aktywność świadomych inwestorów zanim osiągnięta zostanie równowaga cenowa
- Redukuj szum od nieświadomych uczestników rynku i detalicznego przepływu zleceń
- Osiągaj lepsze właściwości statystyczne (IID zwroty o rozkładzie zbliżonym do Gaussa) niż próbkowanie oparte na czasie
- Stosuj sprawdzoną metodologię finansów ilościowych używaną przez inwestorów instytucjonalnych
- Identyfikuj asymetryczne informacje w przepływie zleceń — sprawdzony wskaźnik kierunku ceny
Praktyczny przewodnik konfiguracji podstawowej ( ! )
- Zastosuj wskaźnik na interwale 1-minutowym (lub niższym - używaj wykresów tickowych)
- E[T] - Wprowadź oczekiwaną liczbę ticków na świecę do próbkowania (zacznij od 1000)
- EWMA Alpha - [0,001 - 0,5], gdzie 0,001 da najbardziej stabilne wyniki (w teorii), a 0,5 spowoduje, że TIB będzie oparty na nowszych danych
- Początkowa nierównowaga - zalecana 0,5, ale możesz eksperymentować (0,5 = neutralna nierównowaga przy inicjalizacji)
Podsumowanie
The indicator classifies each trade as buying (+1) or selling (-1) pressure using the tick rule and accumulates these signed ticks until a dynamic threshold—calculated via an Exponentially Weighted Moving Average (EWMA)—is exceeded. When this threshold is breached, a new Tick Imbalance Bar (TIB) is formed, each containing roughly equal market information regardless of elapsed time or volume.
Key features include real-time visualization of cumulative imbalance versus dynamic thresholds, candle coloring by TIB membership, live display of the developing bar, a minimum ticks filter for statistical significance, configurable expected bar size and EWMA parameters, and dashboard metrics tracking imbalance intensity and information density.
This approach enables more frequent sampling during high-information periods, reduces noise from uninformed trades, and provides better statistical properties than time-based sampling. It supports markets including Forex, indices, and cryptocurrencies, and is suitable for strategies such as scalping and breakout trading.
Opinie klientów
5 | 100 % | |
4 | 0 % | |
3 | 0 % | |
2 | 0 % | |
1 | 0 % |


