Descrizione
La maggior parte degli indicatori di tendenza risponde alla stessa domanda allo stesso modo: liscia il prezzo, traccia alcune linee, cerca incroci. Il FDQ Price Channel è stato costruito attorno a una domanda diversa — cosa sta effettivamente facendo il prezzo, privato del rumore e della deriva, e cosa ti dice su dove è probabile che vada?
Il risultato è un indicatore di tendenza basato su un canale che combina tre distinti livelli analitici in un'unica sovrapposizione leggibile.
- Punti Chiave
Un Punto di Partenza Diverso. La serie di prezzi che la maggior parte degli indicatori usa è, statisticamente, un problema.
I prezzi grezzi contengono una componente di cammino casuale che oscura una struttura significativa. Prima che venga tracciato qualsiasi canale, FDQ applica una trasformazione di differenziazione frazionaria — una tecnica presa in prestito dalla ricerca quantitativa — che rimuove questa deriva preservando deliberatamente la memoria a lungo termine nei dati. Ciò che rimane è una serie trasformata che riflette ancora dove il mercato è stato, ma non è più dominata da dove si trova attualmente. Questa è la base su cui si costruisce tutto il resto.
- Il Rumore Ha un Costo
Ogni metodo di lisciatura basato sul ritardo scambia il tempismo per accuratezza. Il filtro di Kalman no.
Il filtro di Kalman è un processo di stima ricorsiva: aggiorna continuamente la sua visione del mercato, bilanciando quanto fidarsi dei nuovi dati rispetto a ciò che ha già stabilito. A differenza di una media mobile, non ha una finestra di lookback fissa e non tratta tutti i bar passati allo stesso modo. L'output è una rappresentazione più pulita del prezzo che risponde rapidamente ai movimenti genuini e resiste a reagire al rumore — senza i segnali ritardati che la lisciatura tipicamente produce.
- Bande Costruite dal Comportamento, Non da una Formula
Le bande di deviazione standard presumono che il prezzo sia distribuito normalmente. Raramente lo è.
I limiti del canale FDQ sono definiti usando l'analisi quantile — la distribuzione statistica reale del prezzo trasformato nel periodo di lookback. La banda alta segna il livello che la serie raggiunge genuinamente all'estremo superiore del suo intervallo; la banda bassa fa lo stesso all'estremo inferiore. Questi non sono confini teorici calcolati da una media — riflettono dove il prezzo è effettivamente stato scambiato, il che li rende più reattivi a come il mercato si comporta realmente in un dato momento.
- Un Secondo Livello Dentro il Canale
Le bande esterne definiscono l'intervallo. Le bande interne definiscono la zona.
Un secondo set di bande si trova proporzionalmente tra il canale esterno e la sua linea mediana. Questo livello interno crea una zona di trading distinta — più stretta del canale completo, ancorata alla stessa base statistica — che serve come riferimento graduato per ingressi e classificazione dei segnali.
- Stato della Tendenza Prima di Tutto il Resto
Un segnale senza contesto è solo un dato casuale.
L'indicatore traccia continuamente lo stato direzionale del canale, usando un meccanismo di voto a maggioranza tra i tre componenti della banda. Quando almeno due dei tre si muovono nella stessa direzione, lo stato della tendenza è confermato come Crescente o Decrescente. I segnali sono generati solo in allineamento con lo stato attuale — setup long solo in condizioni Crescente, setup short solo in condizioni Decrescente. Quando il mercato non soddisfa questa soglia, nessuno stato è dichiarato e nessun segnale è generato. Le transizioni tra stati sono segnate come linee verticali direttamente sul grafico.
- Tre Distinti Setup di Rimbalzo
Non tutti i pullback sono uguali. L'indicatore riconosce tre gradazioni.
Una volta che uno stato di tendenza è attivo, l'indicatore osserva specifici schemi di rimbalzo — momenti in cui il prezzo si è mosso contro la tendenza, ha toccato un livello definito e si è invertito tornando indietro.
-
- Rimbalzo Medio — Il prezzo scende sotto (o sale sopra) la linea mediana del canale e si riprende. Un pullback standard all'interno di una tendenza.
- Rimbalzo Profondo — Il prezzo si estende ulteriormente, raggiungendo l'estremo della banda interna prima di riprendersi. Un pullback più deciso con un'inversione più netta.
- Rimbalzo Leggero — Il prezzo tocca la banda interna dal lato della tendenza e rimbalza indietro. Il più superficiale dei tre, il più frequente.
Ogni tipo è visivamente distinto sul grafico e può essere abilitato o disabilitato indipendentemente.
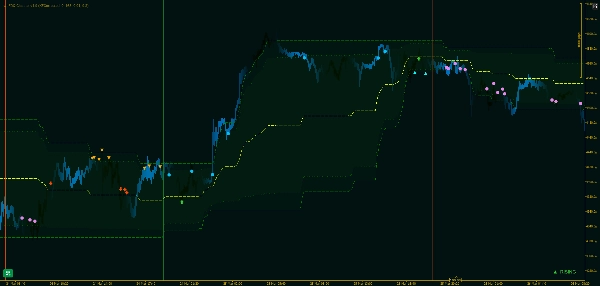
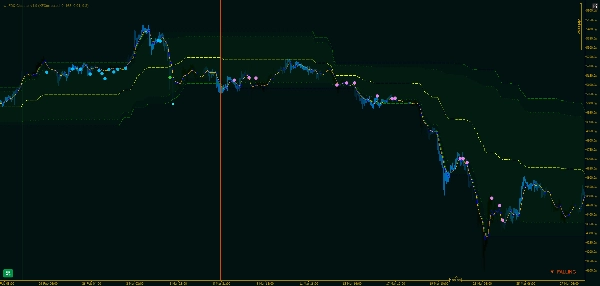
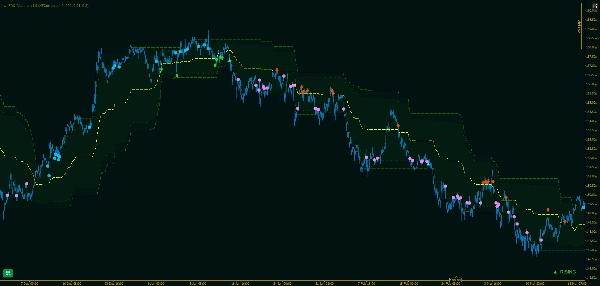
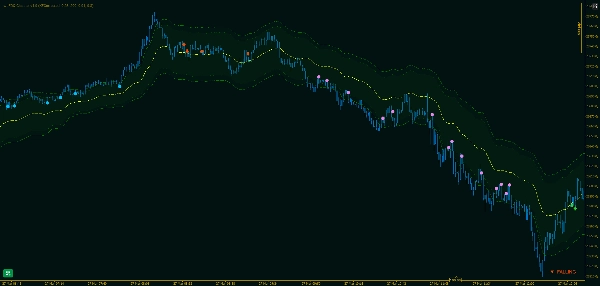
- Cosa Vedi
Il grafico racconta la storia direttamente, senza interpretazioni.
Il canale principale, le bande interne e la linea mediana sovrappongono il prezzo come linee continue. Le transizioni di regime sono segnate con linee verticali — verdi per Crescente, rosse per Decrescente — così la storia dei cambiamenti di stato della tendenza è visibile a colpo d'occhio. I marcatori di segnale appaiono alla barra dove ogni rimbalzo è confermato, con icone separate per ogni tipo di segnale e direzione.
- Perché Questo Approccio Regge
La maggior parte degli indicatori di canale ritarda quando i mercati si muovono velocemente e reagisce eccessivamente quando non lo fanno.
Poiché il canale FDQ è costruito su una trasformazione stazionaria che preserva la memoria piuttosto che su una media mobile, le bande si adattano alla distribuzione del comportamento reale invece di inseguire il prezzo. Il livello Kalman mantiene la stima sottostante pulita senza introdurre il costo temporale che deriva dalla lisciatura con finestra. Il risultato è un canale che rimane significativo in diverse condizioni di mercato — in tendenza, laterale e transitorio — senza bisogno di aggiustamenti manuali.
Riepilogo
The channel boundaries are defined by quantile analysis of the transformed price distribution rather than standard deviation, capturing actual price extremes over the lookback period. It features outer bands marking the full range and inner bands creating a narrower trading zone for refined entry signals. The indicator continuously tracks trend direction using a majority vote across three band components, confirming Rising or Falling states and marking transitions with vertical lines on the chart.
Within active trends, wt.FDQ Channel identifies three distinct rebound setups—Light, Mid, and Deep—each representing different pullback intensities and reversal confirmations. These signals are visually distinct and configurable. The overlay displays the primary channel, inner bands, midline, trend states, and rebound signals directly on the price chart, supporting analysis across various markets including Forex, indices, and cryptocurrencies.
Recensioni dei clienti
5 | 100 % | |
4 | 0 % | |
3 | 0 % | |
2 | 0 % | |
1 | 0 % |


![Logo di "[Stellar Strategies] Market Session Ultimate"](https://cdn.ctrader.com/image/webp/61ffd537-0125-4246-9e72-42eca1791d64_28232)


