present
Zarejestruj się i otrzymaj 50 $ zniżki na pierwszy zakup
Trading product for CISD with STDV ICT Wskaźnik Fibonacci Signal, image 1
CISD with STDV ICT
Wskaźnik
3 zakupy
Wersja 1.0, Mar 2026
Windows, Mac
4.5
Opinie: 4
Trading product for CISD with STDV ICT Wskaźnik Fibonacci Signal, image 2
Trading product for CISD with STDV ICT Wskaźnik Fibonacci Signal, image 3
Trading product for CISD with STDV ICT Wskaźnik Fibonacci Signal, image 4
Trading product for CISD with STDV ICT Wskaźnik Fibonacci Signal, image 5
604.52M
Wolumen transakcji
2.6M
Zysk w pipsach
23
Sprzedaż

Opis

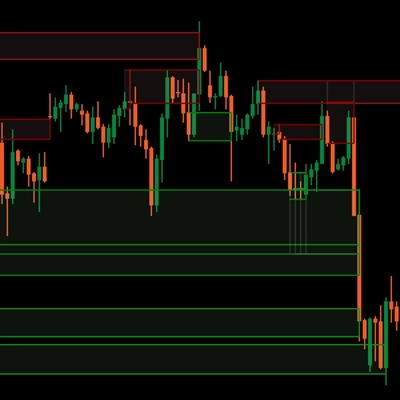
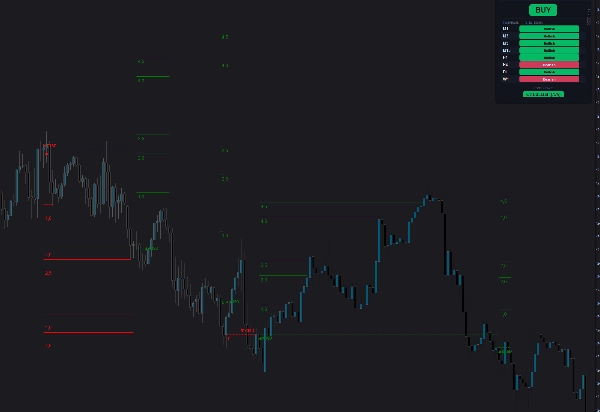
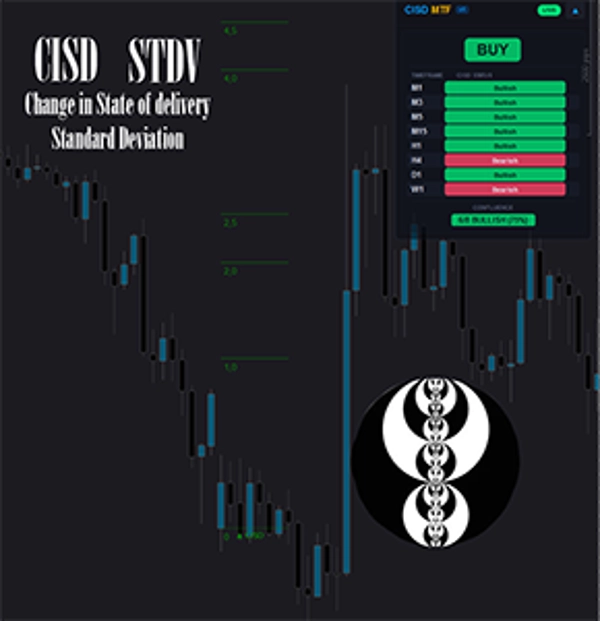
Wskaźnik CISD Projections Panel to zaawansowane narzędzie handlowe dla cTrader, zaprojektowane do wykrywania precyzyjnych zmian struktury rynku (CISD – Change in State of Delivery) oraz automatycznego generowania poziomów projekcji wraz z potwierdzeniem na wielu ramach czasowych.

🔍 Co robi ten wskaźnik?

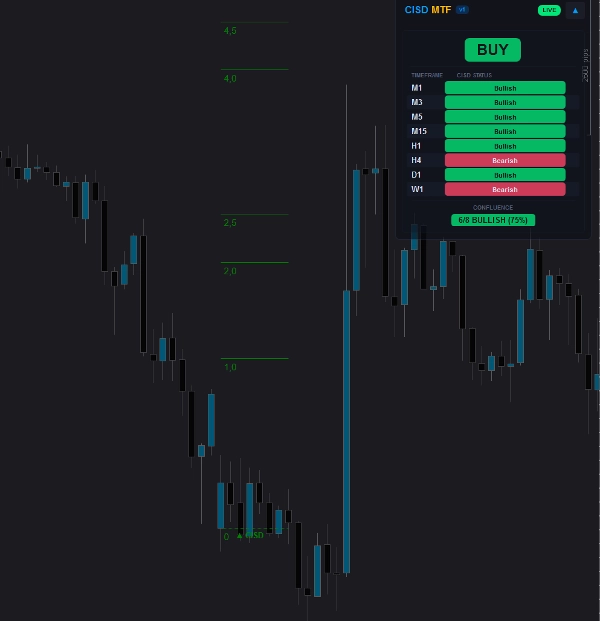
Ten wskaźnik analizuje ruch cen w czasie rzeczywistym, aby zidentyfikować przejścia między byczymi a niedźwiedzimi fazami rynku. Po wykryciu ważnego CISD automatycznie rysuje poziomy projekcji na podstawie poprzedniego zakresu cen, pomagając traderom przewidywać przyszłe ruchy cen.

📊 Kluczowe funkcje

1. Automatyczne wykrywanie CISD

  • Identyfikuje bycze i niedźwiedzie wzorce CISD
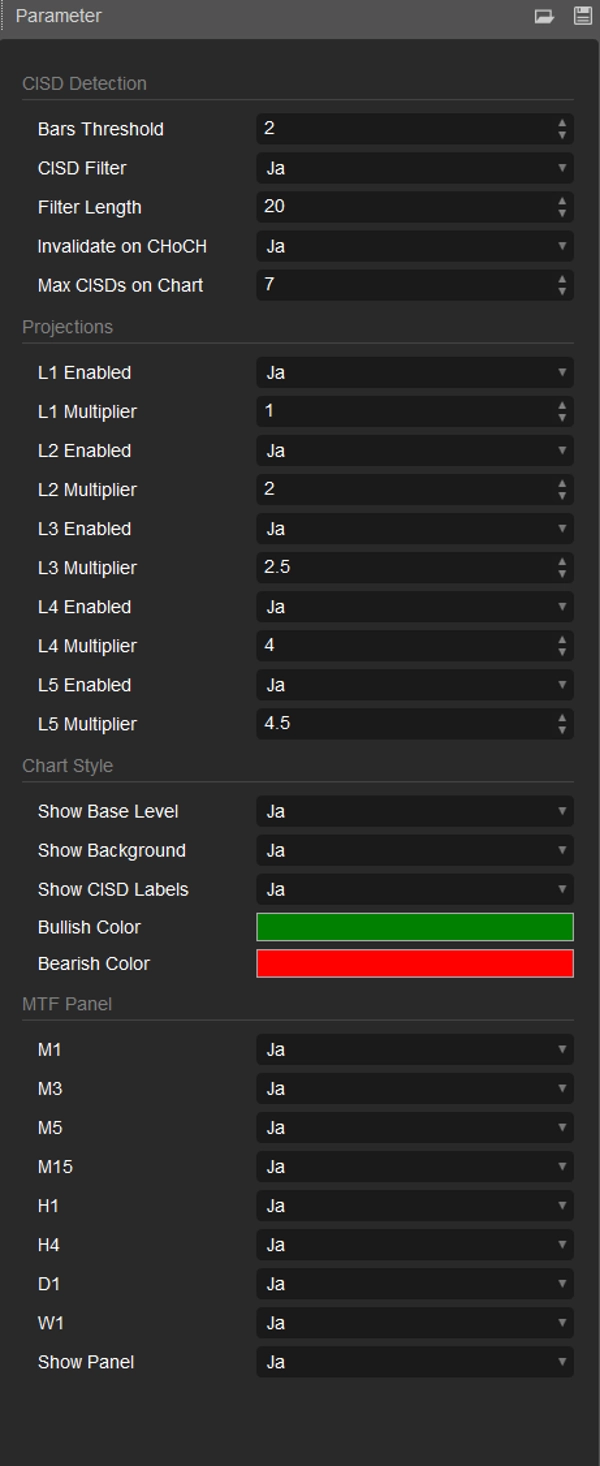
  • Konfigurowalny próg słupków do walidacji sygnału
  • Opcjonalny filtr poprawiający jakość sygnału
  • Automatyczne unieważnienie przy naruszeniach struktury rynku (CHoCH)

2. Poziomy projekcji (cele)

  • Do 5 konfigurowalnych poziomów projekcji (L1–L5)
  • W pełni regulowane mnożniki dla każdego poziomu
  • Dynamiczne rozszerzanie poziomów wraz z rozwojem ceny
  • Wizualne śledzenie osiągniętych celów

3. Inteligentna wizualizacja wykresu

  • Czysta i intuicyjna nakładka bezpośrednio na wykresie
  • Strefy bycze i niedźwiedzie oznaczone kolorami
  • Podświetlenie tła aktywnych zakresów
  • Opcjonalne etykiety CISD i wyświetlanie poziomu bazowego

4. Panel wieloramowy (MTF)

  • Wyświetla bieżące nastawienie na wielu ramach czasowych (M1 do W1)
  • Wyraźny status byczy/niedźwiedzi dla każdej ramy czasowej
  • Automatyczne obliczanie konfluencji
  • Generuje sygnały o wysokim prawdopodobieństwie, takie jak:
    • BUY / SELL (silna zgodność)
    • LEAN BULL / LEAN BEAR (umiarkowane nastawienie)
    • MIXED / WAITING (brak wyraźnego kierunku)

5. Silnik konfluencji
Wbudowany system konfluencji agreguje sygnały ze wszystkich wybranych ram czasowych i oblicza procentowe nastawienie kierunkowe, dając traderom potężną przewagę w podejmowaniu decyzji.

⚙️ Opcje dostosowywania

  • Włącz/wyłącz konkretne ramy czasowe
  • Dostosuj mnożniki projekcji
  • Przełącz elementy wizualne (tło, etykiety, panel)
  • Kontroluj liczbę wyświetlanych CISD

🎯 Dla kogo jest to narzędzie?

  • Traderzy korzystający z analizy ruchu cen
  • Użytkownicy koncepcji smart money (SMC)
  • Traderzy intraday i swingowi
  • Traderzy poszukujący uporządkowanych, opartych na regułach sygnałów

🚀 Dlaczego warto używać tego wskaźnika?

Zamiast ręcznie identyfikować zmiany struktury i projekcje celów, to narzędzie automatyzuje cały proces, dostarczając jasne, obiektywne i wizualnie intuicyjne wskazówki handlowe.

Podsumowanie

Podsumowanie AI
The CISD with STDV ICT indicator for cTrader is a tool designed to detect market structure shifts, known as Change in State of Delivery (CISD), and automatically generate projection levels to anticipate price movements. It analyzes real-time price action to identify transitions between bullish and bearish phases, drawing up to five customizable target levels with adjustable multipliers that dynamically extend as price evolves.

Key features include automatic detection of bullish and bearish CISD patterns with configurable validation thresholds and filters, and automatic invalidation upon market structure breaks. The indicator provides a clean, color-coded chart overlay highlighting active ranges and CISD zones, with optional labels and base level display.

A multi-timeframe (MTF) panel displays real-time bullish or bearish bias across multiple timeframes from 1 minute to 1 week, calculating confluence and generating signals such as BUY, SELL, LEAN BULL, LEAN BEAR, or WAITING. The built-in confluence engine aggregates signals from selected timeframes to provide a percentage-based directional bias.

Customization options allow enabling/disabling specific timeframes, adjusting projection multipliers, toggling visual elements, and controlling the number of displayed CISDs. This indicator is suited for price action traders, smart money concept users, and intraday or swing traders seeking structured, rule-based signals across various markets including Forex, indices, commodities, crypto, and stocks.
Profil wskaźnika
Kategoria wskaźnika
Struktura rynku (SMC)
Typ wyjścia
Wizualizacja
Sygnały
Wymagania dotyczące danych
Tylko słupki
Obsługiwane sygnały
Przełamanie
Siła trendu
Zmienność

Opinie klientów

4.5
Opinie: 4
5
50 %
4
50 %
3
0 %
2
0 %
1
0 %
Opinie klientów
April 10, 2026
Nice for review work. The value is not huge hype, it is the way structure is easier to map during liquidity moves.
April 9, 2026
tested like a normal trader would, small size first. The idea is fine, but No reason to scale it before seeing how it handles bad days. Better rechecked it on 3 sessions.
April 5, 2026
feels cleaner once expectations are normal. It can help with smart money style analysis, but the trader still needs to know why the entry makes sense.
March 31, 2026
Better for someone who wants less noise in the process. The best use is mapping liquidity before entries, then leaving the final filter manual.

Dyskusja

Częste pytania

Fibonacci
Signal
Breakout
Indices
Commodities
SMC
ATR
Produkty dostępne za pośrednictwem cTrader Store, w tym boty handlowe, wskaźniki i wtyczki, dostarczane są przez deweloperów zewnętrznych i udostępniane wyłącznie w celach informacyjnych oraz w celu zapewnienia dostępu technicznego. cTrader Store nie jest brokerem i nie zapewnia doradztwa inwestycyjnego, nie udziela spersonalizowanych rekomendacji ani nie gwarantuje przyszłych wyników.

Więcej od tego autora

Wskaźnik
ATR
SMC
+7
SMC indicator for cTrader detecting order blocks, fair value gaps, liquidity sweeps and market structure with buy/sell
Wskaźnik
ATR
SMC
+12
Next-gen SMC + ICT strategy. Institutional signals, A+ scoring, and precision entries built for modern markets.
Logo „SMC-ICT Control Panel”
Najwyżej oceniane
4.2
(4)
od $19
Wskaźnik
SMC
BTCUSD
+5
SMC ICT Control Panel The all-in-one Smart Money command center for cTrader. One indicator. Every SMC/ICT tool. Zero clu
Wskaźnik
ATR
EMA
+3
High-Tech 3-Level Squeeze Detection with HTF Filter, Carter Entry/Exit Rules, Signal Quality Grading & Real-Time
Wskaźnik
VWAP
NAS100
+5
Key NY session opens for NASDAQ (US100) & SP500 to find Tick Precise Entrys for High R:R intraday setups.
Wskaźnik
ADX
ATR
+3
Nine live gauges turn raw market data into one clear dashboard. Trend, volume, volatility - at a glance, any symbol.
Logo „Phoenix SMC V5.2”
Najwyżej oceniane
4.7
(4)
od $19
Wskaźnik
SMC
VWAP
+5
Non-Repainting Logic All Signals Are Generated In Real Time And Remain Locked Once Printed. No Hindsight Adjustments.
Wskaźnik
ATR
SMC
+9
Advanced SMC/ICT Engine: MTF Structure, Liquidity Sweeps, Real-time Scoring & Pro Risk Dashboard. 100% Non-Repaint
cBot
ATR
SMC
+9
Apex OB Pro: Elite SMC Bot. Multi-TF Order Blocks, CHoCH detection & Dynamic Scoring for Professional cTrader Users.
93.3%
ROI
2.91
Współczynnik zysku
Wskaźnik
BOS
VWAP
+3
Kurzbeschreibung (max. 120 Zeichen) SOB Fusion v3.6: SMC + VWAP confluence indicator with HTF bias, session/ADR filters
Wskaźnik
ADX
ATR
+3
Precision sniper-style confluence entries with graded signals, auto SL/TP & live backtest — 7 presets, MTF bias.
Wskaźnik
SMC
VWAP
+5
SMT Divergence Pro detects bullish and bearish SMT divergences between correlated markets for precise trade entries.

Możesz także polubić

Wskaźnik
RSI
Signal
+3
The Wyckoff Toolkit is the ultimate ally for traders seeking to decode the market through the lens of "smart money."
Wskaźnik
MSS
VWAP
+5
VWAP mean-reversion signals combined with a ribbon-anchored volume profile, VAH/VAL, POC and HVN levels.
Logo „cAlgoBuddy - TDI Pro”
Najwyżej oceniane
4.7
(4)
$129
Wskaźnik
RSI
Forex
+10
All in One indicator designed to reveal Market Sentiment.
Wskaźnik
ATR
SMC
+9
Advanced SMC/ICT Engine: MTF Structure, Liquidity Sweeps, Real-time Scoring & Pro Risk Dashboard. 100% Non-Repaint
Logo „Imperium MTF Heatmap”
Najwyżej oceniane
4.5
(4)
$99
/
$149
Wskaźnik
AI
ATR
+27
Imperium MTF Heatmap is a unique top-tier indicator for cTrader, created for traders who want more than signals
Wskaźnik
Forex
Crypto
+5
Volume Imbalance Bars Indicator - brings institutional-grade market microstructure analysis to cTrader.
Logo „wt.Z-Trend”
Najwyżej oceniane
4.5
(4)
od $9
Wskaźnik
Forex
Crypto
+5
This indicator combines two independent analytical engines into a single overlay on your chart.
Wskaźnik
RSI
Forex
+7
Advanced S/R + liquidity zone detector with auto-configured trade styles. Generates filtered entry signals with TP/SL.
Wskaźnik
EMA
Channel
+3
Real-time squeeze detection, dual-horizon trend scoring & institutional breakout validation HUD dashboard.
Wskaźnik
AI
RSI
+19
The HAI Quantum V10 is an advanced indicator designed for technical analysis.
Logo „BvsB 2026”
Najwyżej oceniane
4.7
(4)
$100
Wskaźnik
Prop
Forex
+1
Smart support/resistance indicator with rejection-only Buy/Sell signals designed for H1 charts.
Wskaźnik
BOS
CHOCH
+5
Bid x ask footprint with imbalances, absorption, delta, volume profile, TPO, market read and a live position panel.
Wskaźnik
AI
ATR
+18
Advanced Level 2 market analysis tool.
Wskaźnik
Grid
Prop
+5
This technical analysis indicator provides information on market sentiment, trend and price levels....
Wskaźnik
ATR
SMC
+20
Session boxes, liquidity sweeps and higher‑timeframe levels for intraday trading
Wskaźnik
ATR
EMA
+5
Multi-factor volatility squeeze detector, dual-trend scoring & breakout validation dashboard. No repaint.
Wskaźnik
BOS
Fibonacci
+4
Market structure, liquidity sweeps, BOS/CHoCH, smart zones and BUY/SELL setups with Entry, SL and TP.
Wskaźnik
Liquidity Grab
Liquidity Sweep
+2
Visualizes accumulation ranges, manipulation sweeps and distribution phases on your cTrader chart.

Cena

604.52M
Wolumen transakcji
2.6M
Zysk w pipsach
23
Sprzedaż