説明
このインジケーターは、価格の動き📈を分析して、市場構造の変化や重要な関心領域を特定することに基づいています。以下は、その動作の詳細な概要です:
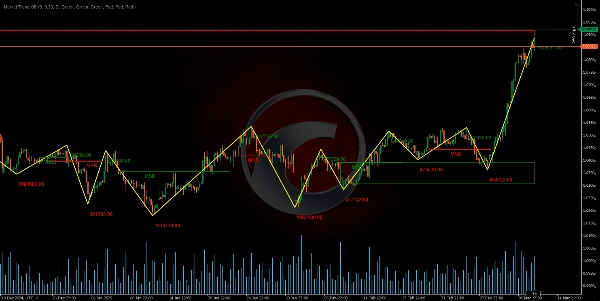
ピボットの検出とジグザグの形成🔄
特定の期間(長さパラメーターで定義)を分析して、相対的な高値と安値を特定します。その区間内の価格を比較することで、ピボットポイント(転換点)が検出され、それがジグザグパターン⚡を形成します。このパターンは、価格の反転がいつ起こるかを区別するのに役立ちます。
出来高の蓄積と偏差の計算📊
ピボット検出の過程で、ティックボリュームが評価された区間で蓄積されます。さらに、ピボット価格間のパーセンテージ差が計算され、動きが十分に重要かどうかを判断します。この偏差は定義された閾値と比較され、市場構造の変化が実際のもの✅であることを確認するのに役立ちます。
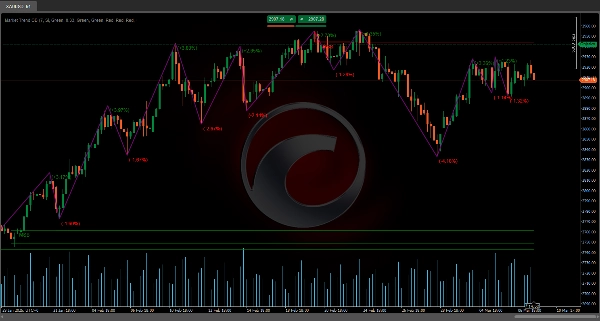
市場構造のブレイク(MSB)の定義🚨
インジケーターは最後の2つのピボット(高値または安値)を評価し、リトレースメントファクター(フィボナッチレベルに着想を得た)を適用して、構造のブレイクが起こったかどうかを判断します。
- 古い高値を破った後、価格がより低い安値を生成し始めた場合、ベアリッシュ構造へのシフトが識別されます🐻。
- 同様に、古い安値を破った後、価格がより高い高値を生成した場合、ブルリッシュ構造への移行が想定されます🐂。
この変化は、市場構造のブレイク(MSB)として解釈されます。
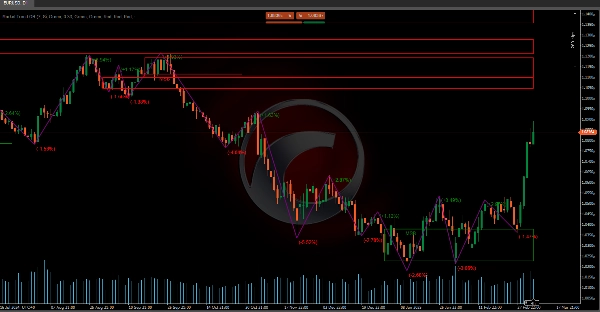
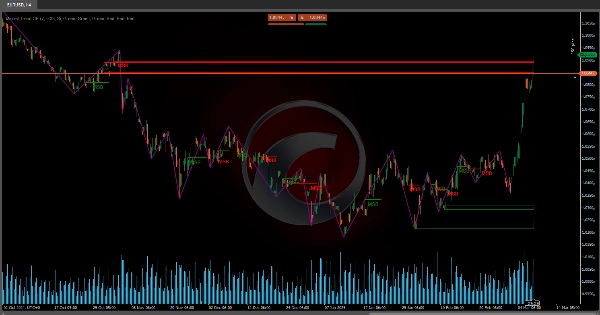
オーダーブロックとブレイクアウトボックスの識別📦
MSBが検出されると、過去の価格動作に基づいて重要なゾーンが定義されます:
- オーダーブロック(OB)🧱:これは、ブレイクアウト前に最後に重要な動作があったゾーンとして識別されます。ベアリッシュ構造では、新しい高値の前の最後のブルキャンドルが使用され、ブルリッシュ構造では、新しい安値の前の最後のベアキャンドルが使用されます。
- ブレイクアウトボックス(BB)📈:これらは同様に決定されますが、価格が前のレベルを破ったことを確認するために追加の範囲を考慮します。
これらのゾーンは、活動が集中するエリアを定義し、将来的にサポートまたはレジスタンスとして機能する可能性があります。
関連するジグザグデータの可視化📊
ピボットの連続をプロットすることに加え、インジケーターは追加のデータを組み込みます:
- 反転価格💹:トレンドの変化が検出された正確な値が記録されます。
- 反転のパーセンテージ変化🔄:新しいピボット価格と前の価格の間のパーセンテージ変動が計算され、変化の大きさを示します。
- 蓄積された出来高📉:ピボット形成に至る区間中のティックボリュームの合計が表示されます。
このデータにより、仮定に頼らず、具体的な計算に基づいて動きの強さと重要性を評価できます。
まとめると、このツールは価格の動きを分析して市場のトレンド変化(MSB)を検出し、取引の意思決定に重要となるゾーン(オーダーブロックとブレイクアウトボックス)を定義します💼。ジグザグパターンと出来高分析およびパーセンテージ偏差の統合により、市場構造の包括的な視点を提供し、反転ポイントと動きの強さについて正確な情報を提供します💪。
Ctraderストアのインジケーター:
概要
It defines Market Structure Breaks (MSB) by evaluating recent pivots with a retracement factor inspired by Fibonacci levels. A break in structure is signaled when price action shifts from higher highs to lower lows (bearish) or from lower lows to higher highs (bullish).
Upon detecting an MSB, the indicator identifies critical zones: Order Blocks (OB), representing the last significant candle before a breakout, and Breakout Boxes (BB), which confirm price level breaches with an additional range. These zones serve as potential future support or resistance areas.
The tool visualizes relevant zigzag data, including reversal prices, percentage changes, and accumulated volume, enabling assessment of movement strength and relevance based on concrete calculations. This comprehensive approach integrates zigzag patterns, volume analysis, and deviation metrics to provide precise information on reversal points and market movement strength, supporting informed trading decisions.
カスタマーレビュー
5 | 100 % | |
4 | 0 % | |
3 | 0 % | |
2 | 0 % | |
1 | 0 % |