
الوصف
تم إنشاء cBot يستخدم مؤشر CRTIndicator لتعيين مستويات وقف الخسارة وجني الأرباح.
الفكرة هي استخدام مستويات CRT (العالية، المتوسطة، المنخفضة) لشمعة سابقة (محددة بواسطة CandleIndex) لتعيين وقف الخسارة وجني الأرباح لتداول جديد.
الخطوات:
- سنقوم بإنشاء cBot يفتح صفقة (شراء أو بيع) بناءً على بعض الشروط (والتي سنحددها كمعامل للاختبار).
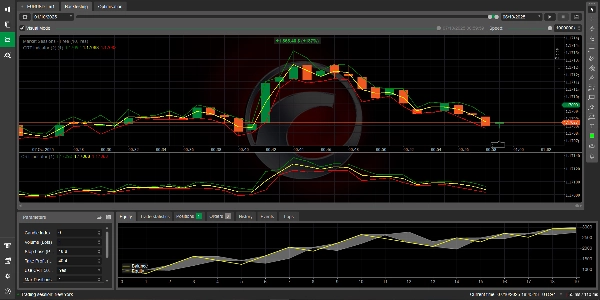
- سنستخدم مؤشر CRTIndicator للحصول على المستويات من شمعة سابقة (يتم تعيين مؤشر الشمعة بواسطة المستخدم).
- لتداول شراء، سنحدد وقف الخسارة عند أدنى مستوى CRT وجني الأرباح عند أعلى مستوى CRT للشمعة المرجعية.
- لتداول بيع، سنحدد وقف الخسارة عند أعلى مستوى CRT وجني الأرباح عند أدنى مستوى CRT للشمعة المرجعية.
ومع ذلك، لاحظ أن مؤشر CRTIndicator الذي لدينا يحسب فقط المستويات لكل شمعة ويرسمها.
نحتاج إلى الوصول إلى المؤشر من cBot والحصول على القيم للشمعة المحددة التي نهتم بها.
دعونا نصمم cBot:
المعلمات:
- CandleIndex: أي شمعة سابقة نستخدم (0 = الحالية، 1 = السابقة، إلخ)
- TradeType: يمكننا تعيين معامل للاختيار بين الشراء والبيع للاختبار، أو يمكننا استخدام إشارة (مثل تقاطع المتوسط المتحرك) لاتخاذ القرار.
للبساطة، دعونا نجعل معاملًا لاختيار نوع التداول.
لكن لاحظ: في التداول الحي، سنستخدم بعض الشروط للدخول. سنصنع cBot بسيط يفتح صفقة على الشمعة الحالية إذا لم يكن هناك مركز مفتوح.
سنفترض أننا نتداول على إطار زمني للرسم البياني.
الخطوات في cBot:
- تحقق مما إذا كان لدينا مركز مفتوح. إذا لم يكن كذلك، فكر في الفتح.
- احصل على قيم مؤشر CRTIndicator للشمعة المحددة بواسطة CandleIndex (وهي شمعة ماضية نسبة إلى الحالية).
- لتداول شراء:
وقف الخسارة = أدنى مستوى CRT للشمعة المرجعية
جني الأرباح = أعلى مستوى CRT للشمعة المرجعية - لتداول بيع:
وقف الخسارة = أعلى مستوى CRT للشمعة المرجعية
جني الأرباح = أدنى مستوى CRT للشمعة المرجعية
ومع ذلك، لاحظ أن المؤشر يحسب لكل مؤشر. نحن نرسم نفس القيم لكل مؤشر (لأننا نستخدم إزاحة ثابتة لـ CandleIndex).
لكن في cBot، نريد الحصول على المستويات من المؤشر في الوقت الحالي (الشمعة المكتملة الأحدث) للشمعة المحددة بواسطة CandleIndex.
مهم: يتم استدعاء طريقة Calculate للمؤشر لكل مؤشر، وتخزن القيم للشمعة المرجعية (المؤشر - CandleIndex) عند المؤشر الحالي.
لذا إذا أردنا الحصول على مستويات CRT لشمعة تاريخية محددة، يمكننا ببساطة قراءة سلسلة مخرجات المؤشر عند مؤشر تلك الشمعة؟
لكن لاحظ: مخرجات المؤشر متزامنة مع المؤشر الحالي. في الواقع، المؤشر يرسم نفس القيمة لكل شريط لأننا نعين:
CRTHigh[index] = crtHigh; // حيث crtHigh هو الأعلى للشمعة (index - CandleIndex)
لذا إذا كنا عند المؤشر 100 و CandleIndex=1، فنحن نحصل على الأعلى للمؤشر 99 ونرسمه عند المؤشر 100.
هذا يعني أنه إذا أردنا مستويات CRT للشمعة التي كانت قبل CandleIndex أشرطة، يمكننا الحصول على مخرجات المؤشر عند الشريط الحالي (المؤشر) وهذا سيعطينا المستويات من قبل CandleIndex أشرطة.
لكن انتظر، في cBot، سنشغل OnBar أو OnTick. نحن مهتمون بأحدث شريط مكتمل (المؤشر = MarketSeries.Close.Count - 2) والشمعة التي نريدها هي (المؤشر الحالي - CandleIndex).
بدلاً من ذلك، يمكننا تغيير المؤشر ليخرج المستويات عند نفس مؤشر الشمعة المرجعية، لكن حينها سيتوجب علينا تحريك الرسم بمقدار CandleIndex.
ومع ذلك، المؤشر الحالي مصمم لرسم المستويات عند الشريط الحالي من شريط سابق. لذا إذا ضبطنا CandleIndex=1، عند كل شريط نرسم المستويات من الشريط السابق.
كيف يمكننا استخدامه في cBot:
سنضيف المؤشر إلى cBot ثم نحصل على القيم لأحدث شريط (المؤشر = MarketSeries.Close.Count - 1) وهذا سيعطينا المستويات من قبل CandleIndex أشرطة.
مثال:
مؤشر الشريط الحالي = آخر شريط (المؤشر = MarketSeries.Close.Count - 1)
ثم مخرجات المؤشر عند هذا المؤشر (CRTHigh[MarketSeries.Close.Count-1]) هي الأعلى للشمعة (المؤشر الحالي - CandleIndex).
لكن لاحظ: يتم استدعاء طريقة Calculate للمؤشر لكل شريط تاريخي ثم لكل شريط جديد. لذا سلسلة المخرجات للآخر شريط سيكون لديها القيمة التي نريدها.
دعونا نبرمج cBot:
سيكون لدينا معلمات:
[Parameter("Candle Index", DefaultValue = 1, MinValue = 0)]
public int CandleIndex { get; set; }
[Parameter("Trade Type", DefaultValue = TradeType.Buy)]
public TradeType SelectedTradeType { get; set; }
[Parameter("Volume (Lots)", DefaultValue = 1, MinValue = 0.01, Step = 0.01)]
public double Volume { get; set; }
سننشئ أيضًا مثيلًا من مؤشر CRTIndicator.
الخطوات في OnBar:
إذا لم يكن هناك مركز، فافتح مركزًا جديدًا مع وقف الخسارة وجني الأرباح المعينين من مخرجات المؤشر للشريط الحالي (الذي يتوافق مع المستويات من قبل CandleIndex أشرطة).
ومع ذلك، لاحظ: مخرجات المؤشر للشريط الحالي (آخر شريط) تم تعيينها إلى مستويات (مؤشر الشريط الحالي - CandleIndex). ولكن عندما نكون في البداية جدًا، يجب التأكد من وجود أشرطة كافية.


