
Descripción
RSI Personalizado – Reversiones en el Spot con Precisión y Visuales Claros
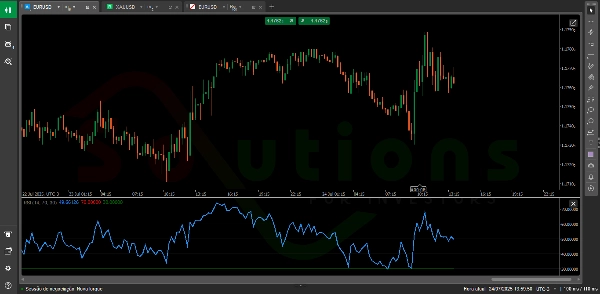
RSI Personalizado es una versión mejorada del clásico Índice de Fuerza Relativa (RSI), diseñado para ayudar a los traders a identificar rápidamente zonas de sobrecompra y sobreventa—áreas clave donde es probable que el precio se revierta.
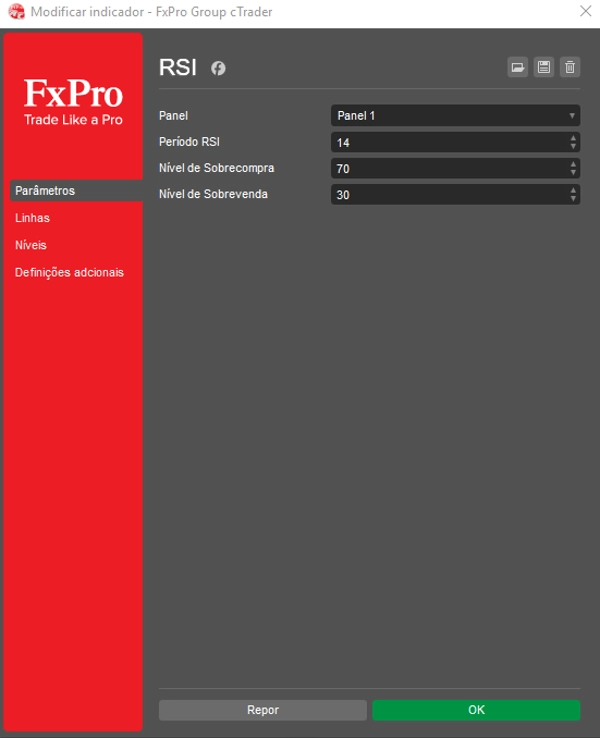
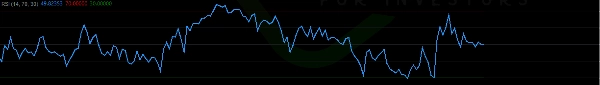
Con una interfaz limpia e intuitiva, muestra dos líneas horizontales totalmente personalizables (como los niveles tradicionales 70 y 30), marcando claramente puntos de decisión de alta probabilidad en el gráfico.
✅ Ajusta el marco temporal y los niveles de RSI para adaptarlos a tu estilo de trading
✅ Identifica zonas potenciales de reversión con mayor confianza
✅ Mejora tu análisis técnico con un indicador claro y sin desorden
Perfecto para traders de todos los niveles, RSI Personalizado transforma los datos de precio en bruto en conocimientos inteligentes y accionables—convirtiéndolo en una herramienta esencial para la toma de decisiones rentables.
Resumen
Valoraciones de clientes
5 | 0 % | |
4 | 100 % | |
3 | 0 % | |
2 | 0 % | |
1 | 0 % |


![Logotipo de "[Hamster-Coder] Bollinger Bands"](https://cdn.ctrader.com/image/webp/21d8e5d6-fb11-4bac-b9ee-cd05c2b76804_30327)


