
Penerangan
BullBear Dynamics — Penunjuk Trend & Momentum untuk cTrader
BullBear Dynamics adalah penunjuk yang kukuh dan peka kepada volatiliti untuk platform cTrader, direka untuk membantu pedagang mengesan dan mentafsir keseimbangan antara momentum bullish dan bearish di pasaran. Ia menggabungkan purata bergerak, penormalan ATR, dan ambang dinamik untuk menyediakan alat yang tepat dan intuitif secara visual untuk penilaian trend.
Metodologi & Logik Dalaman
Penunjuk mengira dua Purata Bergerak Eksponen (EMA): satu EMA jangka pendek dan satu EMA jangka panjang.
Kemudian ia mengambil perbezaan antara EMA ini dan membahagikannya dengan Julat Benar Purata (ATR). Penormalan ini membantu melaraskan isyarat momentum berhubung dengan volatiliti pasaran semasa.
Garis isyarat — EMA yang digunakan pada nilai yang dinormalisasi — menapis bunyi dan melicinkan turun naik kecil.
Untuk membezakan pergerakan lemah daripada kuat, alat ini mengira sisihan piawai bergulung (StdDev) ke atas tetingkap semakan dan mendarabkannya dengan faktor untuk menentukan ambang atas dan bawah.
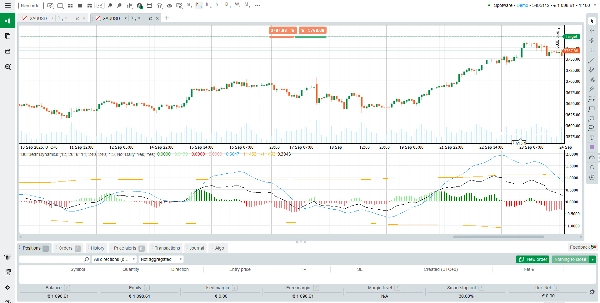
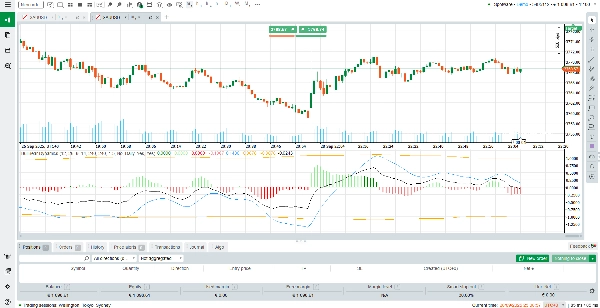
Output akhir divisualisasikan sebagai histogram (dengan pelbagai keadaan warna) serta garis isyarat dan sempadan ambang.
Cara Membaca & Mentafsir Output
Bar Histogram (Hijau / Merah):
• Hijau menunjukkan momentum bullish; merah menunjukkan momentum bearish.
• Warna kuat (lebih cerah atau penuh) bermakna histogram melebihi ambang — menandakan pergerakan yang kuat.
• Warna lemah bermakna histogram kekal di dalam sempadan ambang — menandakan momentum ringan atau bunyi.
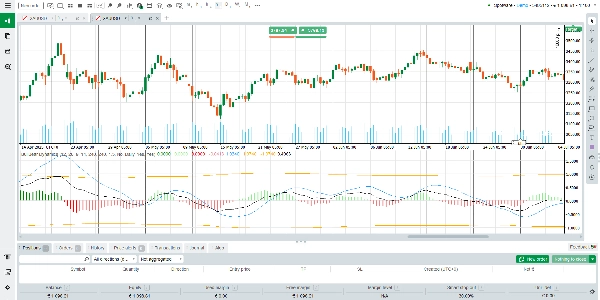
Garis Isyarat:
• Bertindak sebagai garis asas rujukan.
• Apabila histogram melintasi di atas garis isyarat, ini menandakan potensi pengukuhan momentum bullish.
• Apabila ia melintasi di bawah, ia menandakan potensi pengukuhan momentum bearish.
Garis Ambang (Atas & Bawah):
• Garis putus-putus ini menentukan zon kepentingan.
• Bar histogram yang melintasi melebihi ambang menunjukkan pergerakan momentum yang kuat dan berkeyakinan tinggi.
• Bar yang kekal dalam ambang mencadangkan julat atau ketidaktentuan — isyarat kurang boleh dipercayai.
Senario & Bacaan:
Momentum bullish — bar hijau di atas garis isyarat, sebaiknya juga melintasi ambang atas.
Momentum bearish — bar merah di bawah garis isyarat, sebaiknya juga melintasi ambang bawah.
Neutral / julat — bar berosilasi dalam ambang, warna mungkin berganti-ganti, amplitud kecil.
Peralihan atau pembalikan momentum — histogram melintasi garis isyarat, disertai perubahan warna; jika juga memecah ambang, lebih boleh dipercayai.
Cadangan Penggunaan & Amalan Terbaik
Gunakan BullBear Dynamics bersama alat lain (penapis trend, sokongan/rintangan, analisis corak) untuk pengesahan.
Berhati-hati mentafsir isyarat semasa tempoh volatiliti rendah apabila bar histogram kekal dalam ambang.
Utamakan isyarat di mana histogram melintasi garis isyarat dan memecah ambang.
Sahkan penjajaran arah pada jangka masa lebih tinggi sebelum bertindak atas isyarat jangka masa lebih rendah.
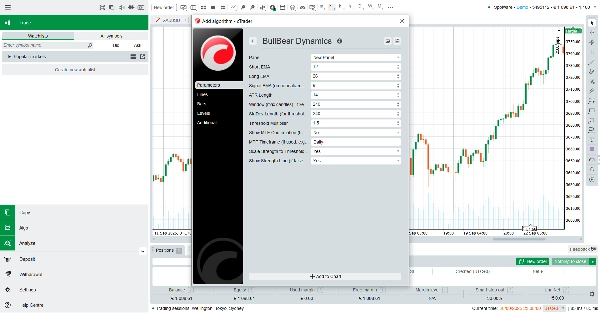
Laraskan parameter (panjang EMA, pengganda ambang, tetingkap StdDev) mengikut keperluan untuk menyesuaikan dengan pasaran berbeza (Forex, indeks, komoditi, kripto).
Ciri-ciri Utama & Sorotan
Penormalan Adaptif Volatiliti — momentum diskalakan oleh ATR, jadi isyarat lebih boleh dipercayai merentasi persekitaran pasaran yang berbeza-beza.
Ambang Dinamik — dibina daripada sisihan piawai bergulung, ia menyesuaikan dengan keadaan pasaran semasa, membantu mengurangkan pecahan palsu.
Histogram Pelbagai Warna Jelas — perbezaan visual antara momentum kuat vs lemah, dan bullish vs bearish.
Keserasian Luas — berfungsi pada semua instrumen dan jangka masa yang disokong oleh cTrader.
Percuma untuk Digunakan — tersedia tanpa kos; sesuai untuk pedagang yang mahukan keupayaan penunjuk lanjutan tanpa langganan.
Ringkasan
The output is displayed as a multi-color histogram with green bars indicating bullish momentum and red bars indicating bearish momentum. The intensity of the colors reflects the strength of the momentum relative to dynamically calculated upper and lower thresholds. The signal line serves as a baseline to identify potential momentum shifts when the histogram crosses it. Threshold lines mark zones of significant momentum moves, with bars crossing these lines signaling stronger trends.
BullBear Dynamics supports all instruments and timeframes available on cTrader, including Forex, commodities, indices, and cryptocurrencies. It is recommended to use this indicator alongside other analysis tools for confirmation and to adjust its parameters to fit different market conditions and trading styles such as scalping.
Ulasan pelanggan
5 | 100 % | |
4 | 0 % | |
3 | 0 % | |
2 | 0 % | |
1 | 0 % |


![Logo "[Stellar Strategies] Linear Regression Candles 1.1"](https://cdn.ctrader.com/image/webp/8b9cff9f-2431-46d2-b0ec-c7f55f4a4a6d_27918)


