
Penerangan
🏆 10,000+ Pedagang Mempercayai Suite Algoritma 25+ Kami! 🏆
Dari Struktur Pasaran & Kecairan ke Sistem Keluar Pintar & Alat Ramalan - kami telah membina SETIAP alat yang anda perlukan untuk konsisten.
👉 Akses Semua 25+ Sistem TERBUKTI:
_______________________________________________
📌 Penunjuk Struktur Pasaran
· ✅ Struktur Pasaran Lanjutan: Bos, Choch, SwinLevels, Blok Pesanan, Pencari Struktur Pasaran& Kecairan
· 🔄 Analisis Struktur Pasaran Dinamik Titik Pusingan
· 🧱 Blok Pesanan
· ⚖️ Ketidakseimbangan Pasaran
· ⛓️ BOS & CHOCH
· 🧠 Kuasa ICT 3
_______________________________________________
🔚 Sistem Keluar Pintar
· 📍 Algoritma Pintar Penjejakan
_______________________________________________
📐 Penunjuk ZigZag
· 🔍 Unjuran Kecairan Harga ZigZag
· ➖ ZigZag
· 🎯 Penjejak Ekstremiti Zig-Zag
_______________________________________________
🧱 Penunjuk Sokongan & Rintangan
· 🟩 Garis Sokongan & Rintangan SmartTrend
· 🧱 Semua Tahap Sokongan dan Rintangan
_______________________________________________
📊 Penunjuk Trend & Saluran
· 📊 Supertrend
· ⚡Penganalisis Trend Momentum
_______________________________________________
💧 Alat Isipadu & Kecairan
· 🔍 Jurang Nilai Adil Momentum
_______________________________________________
⚡ Penunjuk Momentum & RSI
· 🔎 Penjejak Bias Lilin Berbilang Tahap
Tracker
_______________________________________________
🔮 Alat Ramalan & Unjuran
· 📐 Ramalan Berdasarkan Linreg& ATR
· 📏 Regresi Linear FibonacciBerbilang jangka masa
· 📈 Pemproyektor Aliran Pasaran Berkuasa Isipadu_________________________
_________________________________________________________________________________________________
_________________________________________________________________________________________________
ZigZag Structure Pro – 🚀
Secara automatik mengenal pasti titik pusing penting pasaran (tahap tinggi dan rendah utama) dan melukis zon sokongan dan rintangan dinamik yang dikemas kini secara masa nyata. 🎯 Tidak seperti tahap statik tradisional, penunjuk ini sentiasa menyesuaikan diri dengan struktur harga yang berubah.
Apa kegunaannya? ❓
Penunjuk ini adalah alat analisis teknikal profesional yang direka untuk:
- Kenal pasti tahap institusi: 🏛️ Secara automatik mengesan titik di mana harga telah membentuk struktur tinggi dan rendah penting.
- Analisis struktur pasaran: 📊 Mengklasifikasikan setiap pergerakan mengikut metodologi struktur bullish/bearish (Tinggi Lebih Tinggi, Rendah Lebih Rendah, dll.).
- Unjuran trend: 🔮 Memanjangkan garis trend ke masa depan untuk menjangka zon reaksi harga yang berpotensi.
- Perdagangan pembalikan dan kesinambungan: 💰 Tahap yang ditandakan berfungsi sebagai rujukan untuk kemasukan, stop-loss, dan sasaran keuntungan.
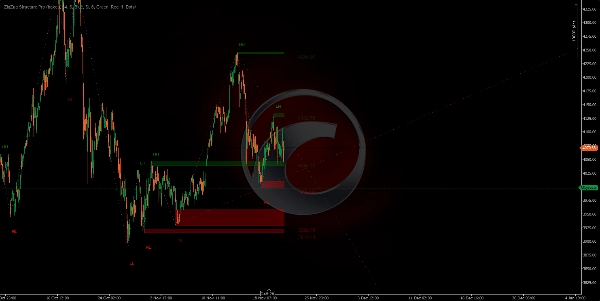
Penunjuk melukis pada carta anda: ✍️
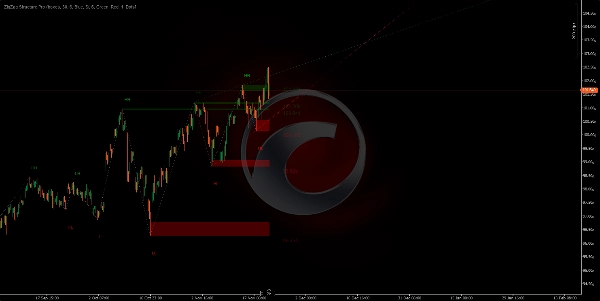
1. Zon Sokongan/Rintangan (Segiempat)
- Zon hijau: 🟢 Menandakan kawasan sokongan (rendah penting di mana harga boleh memantul).
- Zon merah: 🔴 Menandakan kawasan rintangan (tinggi penting di mana harga boleh menarik balik).
- Zon-zon ini dijangka ke hadapan, menunjukkan tahap aktif semasa.
- Ketebalan setiap zon mewakili badan lilin di mana pivot dibentuk.
https://chartshots.spotware.com/c/691f5a4d75ac4
https://chartshots.spotware.com/c/691f6b4f2e98b
https://chartshots.spotware.com/c/691f6c6fda808
https://chartshots.spotware.com/c/691f6d0aa6155
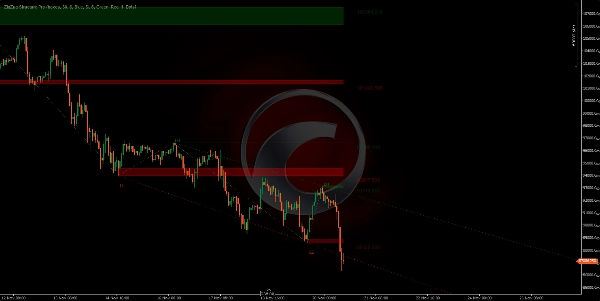
2. Garis Sambungan ⚡
- Sambungkan setiap pivot dengan yang seterusnya, mencipta corak "zigzag" visual.
- Menghapuskan bunyi pasaran, hanya menunjukkan pergerakan yang benar-benar penting.
- Memudahkan untuk melihat arah dan struktur trend dengan sekilas pandang.
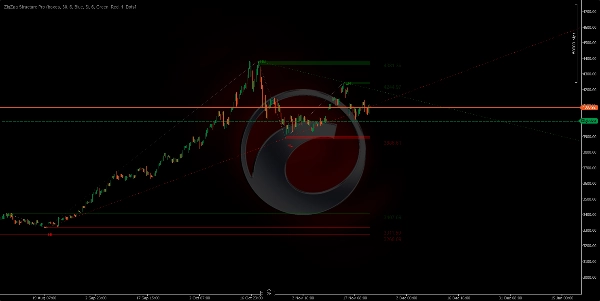
3. Garis Trend Unjuran (Hijau/Merah Diperluas)
- Dilukis dari pivot sebelumnya ke pivot semasa dan diperluas ke masa depan.
- Hijau: 🟢 Garis trend menaik (dari rendah).
- Merah: 🔴 Garis trend menurun (dari tinggi).
- Menunjukkan 2 garis trend terkini dan aktif.
- Berguna untuk mengesan pecahan atau hormat trend.
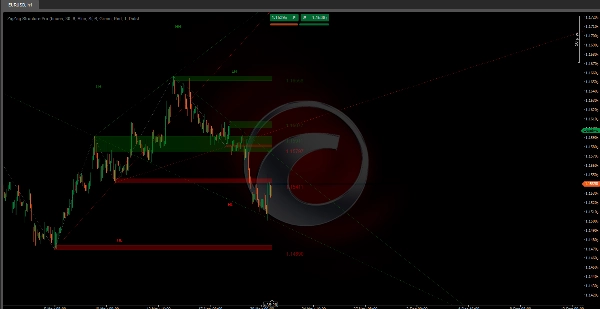
4. Label Struktur Pasaran 🏷️
Setiap pivot menunjukkan label yang menunjukkan klasifikasinya:
- HH (Tinggi Lebih Tinggi): ↗️ Tinggi Lebih Tinggi - Kelanjutan bullish.
- LH (Tinggi Lebih Rendah): ⬆️ Tinggi Lebih Rendah - Kemungkinan pembalikan bearish.
- HL (Rendah Lebih Tinggi): ⬇️ Rendah Lebih Tinggi - Kemungkinan pembalikan bullish.
- LL (Rendah Lebih Rendah): ↘️ Rendah Lebih Rendah - Kelanjutan bearish.
Logik di sebalik algoritma 🧠
Penunjuk menggunakan algoritma zigzag adaptif yang:
- Mengimbas harga mencari tinggi dan rendah dalam tempoh yang boleh dikonfigurasikan (lalai 34 bar).
- Menapis pergerakan yang tidak penting melalui ambang penyimpangan minimum (lalai 6 pips).
- Mengesahkan setiap pivot memastikan ia mewakili perubahan sebenar dalam struktur pasaran.
- Membandingkan struktur antara pivot berturut-turut untuk mengklasifikasikan jenis pergerakan.
- Mengemas kini zon secara dinamik apabila pivot baru muncul, mengeluarkan yang paling lama.
Tetapan Utama ⚙️
- Bar Lihat Kembali Pivot: Mengawal kepekaan pengesan pivot (rendah = lebih banyak pivot, tinggi = hanya pivot utama).
- Penapis Penyimpangan Harga: Penapis bunyi - pergerakan yang lebih kecil daripada nilai ini diabaikan.
- Bilangan Zon Terlihat Maksimum: Bilangan tahap sejarah yang kekal kelihatan (dari 1 hingga 20).
- Jenis Paparan Zon: Pilih antara segiempat (zon penuh) atau garis mudah.
- Tunjukkan Garis Trend Diperluas: Aktifkan/nonaktifkan unjuran trend.
Panduan Parameter Pantas 📖
Bar Lihat Kembali Pivot (Lalai: 30)
- ↑ Tingkatkan (40-100): KURANG pivot, lebih penting. Untuk perdagangan ayunan.
- ↓ Kurangkan (15-25): LEBIH pivot, lebih banyak isyarat. Untuk scalping/perdagangan harian.
Penapis Penyimpangan Harga (Lalai: 6)
- ↑ Tingkatkan (8-15): Menapis bunyi, hanya pergerakan besar. Isyarat kurang, kualiti lebih tinggi.
- ↓ Kurangkan (2-5): Lebih sensitif, menangkap pergerakan kecil. Lebih banyak isyarat.
Bilangan Zon Terlihat Maksimum (Lalai: 6)
- ↑ Tingkatkan (10-20): Lebih banyak tahap sejarah kelihatan. Untuk analisis mendalam.
- ↓ Kurangkan (2-4): Hanya tahap terkini. Carta bersih.
Had Pivot Sejarah (Lalai: 200)
- ↑ Tingkatkan (300-500): Lebih banyak sejarah untuk pengiraan. Analisis jangka panjang.
- ↓ Kurangkan (50-150): Hanya struktur terkini. Prestasi lebih baik.
Kiraan Unjuran Aktif (Lalai: 5)
- ↑ Tingkatkan (5-10): Lebih banyak garis trend yang diunjurkan.
- ↓ Kurangkan (1-2): Hanya trend dominan. Lebih jelas.
Tunjukkan Garis Trend Diperluas (Ya/Tidak)
- Diaktifkan: Mengunjurkan trend ke masa depan.
- Dinonaktifkan: Hanya zigzag sejarah.
🎯 Tetapan Pantas
- Scalping: Lihat Kembali 15-20 | Penyimpangan 3-5 | Zon 3-4
- Perdagangan Harian: Lihat Kembali 25-35 | Penyimpangan 6-8 | Zon 5-6
- Perdagangan Ayunan: Lihat Kembali 40-60 | Penyimpangan 10-15 | Zon 8-12
Ringkasan
Ulasan pelanggan
5 | 0 % | |
4 | 100 % | |
3 | 0 % | |
2 | 0 % | |
1 | 0 % |


![Logo "[Stellar Strategies] Market Session Ultimate"](https://cdn.ctrader.com/image/webp/61ffd537-0125-4246-9e72-42eca1791d64_28232)


