

Penerangan
Visualisasi Sokongan & Rintangan Institusi
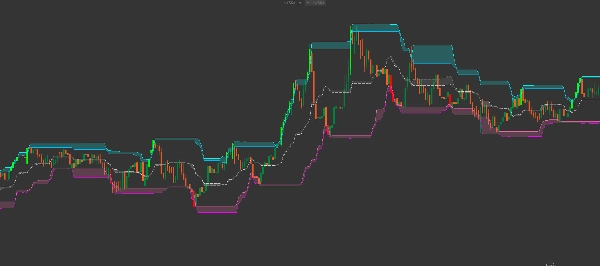
The Smart Donchian Cloud Reversal adalah saluran volatiliti generasi seterusnya yang direka untuk mengenal pasti zon pembalikan berkemungkinan tinggi. Berbeza dengan Saluran Donchian standard yang hanya mengesan paras tertinggi dan terendah, penunjuk ini menganalisis hubungan antara wick lilin dan badan lilin untuk melukis "Awan Tekanan."
Awan-awan ini bertindak sebagai zon Dinamik Bekalan dan Permintaan, menunjukkan dengan tepat di mana pasaran kemungkinan akan berhenti atau berbalik.
Seni Bina Multi-Awan Lanjutan
Penunjuk ini menampilkan sistem awan 3 lapisan yang canggih:
-
- Awan Rintangan (Sian/Biru): Terletak di atas, ia memvisualisasikan jurang antara wick tertinggi dan badan lilin tertinggi. Ini adalah "Zon Jualan."
- Awan Keseimbangan (Kelabu/Perak): Pita tengah yang mengesan keseimbangan pasaran. Ia mewakili titik nilai adil antara wick dan badan.
- Awan Sokongan (Merah Jambu/Magenta): Terletak di bawah, ia memvisualisasikan jurang antara wick terendah dan badan lilin terendah. Ini adalah "Zon Pembelian."
Ciri-ciri Perdagangan Utama
-
- Penapis Volatiliti ATR: Termasuk pengganda ATR (Purata Julat Benar) terbina dalam untuk sedikit mengimbangi jalur luar, menapis bunyi pasaran dan "perburuan hentian."
- Pewarnaan Lilin Pintar: Penunjuk secara automatik menyerlahkan momentum pecahan:
- Lilin LIME: Harga telah ditutup di atas Awan Rintangan Atas (Pecahan Bullish).
- Lilin MERAH: Harga telah ditutup di bawah Awan Sokongan Bawah (Pecahan Bearish).
- Logik Wick vs. Badan: Dengan melihat ketebalan "awan," anda boleh mengukur volatiliti. Awan tebal bermakna wick panjang (penolakan tinggi/ketidaktentuan), manakala awan nipis bermakna tindakan harga yang kuat dan tegas.
Cara Berdagang dengan Awan Donchian Pintar
1. Pembalikan Purata (Scalping) » Cari harga memasuki Awan Rintangan tanpa menutup di atasnya. Ini sering menunjukkan "pura-pura keluar," menandakan kemasukan pendek berkemungkinan tinggi kembali ke Garis Tengah.
2. Pecahan Trend » Apabila lilin berubah menjadi Lime (menutup di atas penapis wick atas), ia menandakan bahawa lembu jantan telah membersihkan zon rintangan. Ini adalah isyarat kuat untuk strategi mengikuti trend.
3. Pantulan Sokongan »Perhatikan Awan Sokongan (Merah Jambu). Apabila harga menyentuh zon ini semasa penarikan balik dalam trend menaik, ia mewakili kawasan "Pembelian Nilai" di mana pembeli institusi sering masuk.
Parameter Teknikal
-
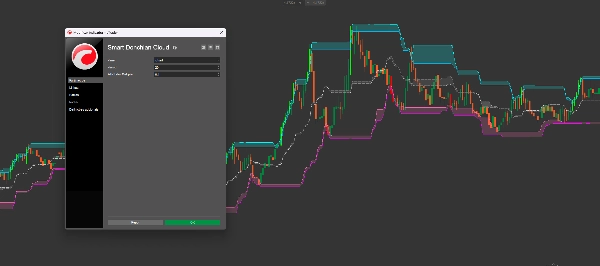
- Tempoh: Tempoh semakan untuk mengira paras tinggi dan rendah (Default: 20).
- Pengganda Penapis ATR: Melaraskan "padding" di sekitar ekstrem untuk mengelakkan terperangkap dalam lonjakan kecil.
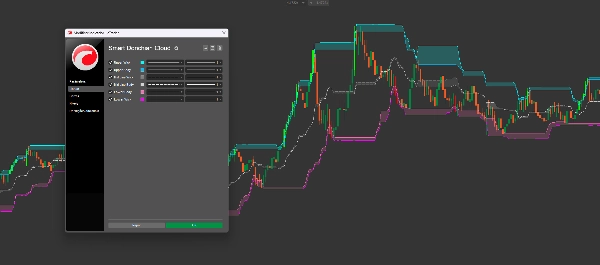
- Warna Boleh Disesuaikan Sepenuhnya: Sesuaikan awan Atas, Tengah, dan Bawah mengikut templat carta peribadi anda.
Mengapa Alat Ini Penting
Kebanyakan pedagang gagal kerana mereka menganggap Sokongan dan Rintangan sebagai garis tunggal. Sebenarnya, ia adalah Zon. The Smart Donchian Cloud Reversal memetakan zon-zon ini secara matematik, memberikan anda gambaran yang lebih jelas tentang struktur pasaran berbanding mana-mana penunjuk saluran tradisional.
Ringkasan
Key features include an ATR-based volatility filter to reduce noise, and smart candle coloring that highlights breakout momentum—lime candles signal bullish breakouts above resistance, while red candles indicate bearish breakouts below support. The thickness of the clouds reflects volatility, with thicker clouds showing higher rejection or indecision.
Traders can use the indicator for mean reversion by spotting price entering but not closing above resistance, trend breakouts confirmed by lime candles, and support bounces where price touches the support cloud during pullbacks. The indicator’s parameters, such as lookback period and ATR multiplier, are customizable, along with cloud colors to fit user preferences.
Ulasan pelanggan
5 | 67 % | |
4 | 33 % | |
3 | 0 % | |
2 | 0 % | |
1 | 0 % |

























