


Beschreibung
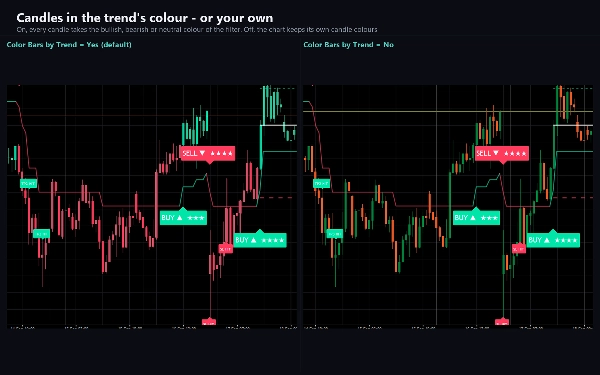
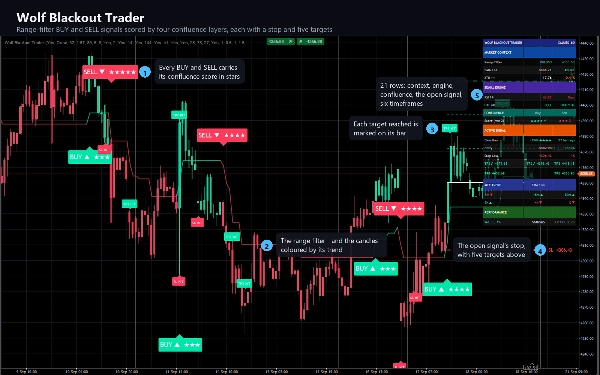
Wolf Blackout Trader folgt einem Range-Filter und färbt jede Kerze entsprechend ihrem Trend um, sodass das Chart
auf einen Blick bullisch, bärisch oder neutral erscheint. Wenn der Trend sich dreht, wird die Wendung durch vier
Konfluenz-Ebenen bewertet, und nur eine Wendung mit ausreichender Übereinstimmung wird zu einem KAUF- oder VERKAUF-Signal. Jedes Signal
kommt mit einem Stop, fünf Zielen und einer Sternebewertung.
WAS ES ZEICHNET
- Kerzen, die nach Trend umgefärbt sind: bullisch, bärisch oder neutral, in den von Ihnen gewählten Farben.
- Die Range-Filter-Linie in denselben Farben.
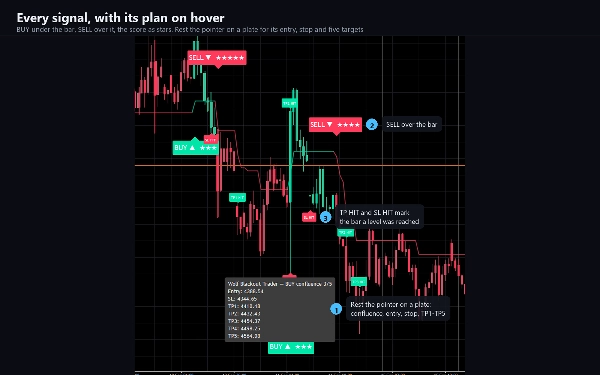
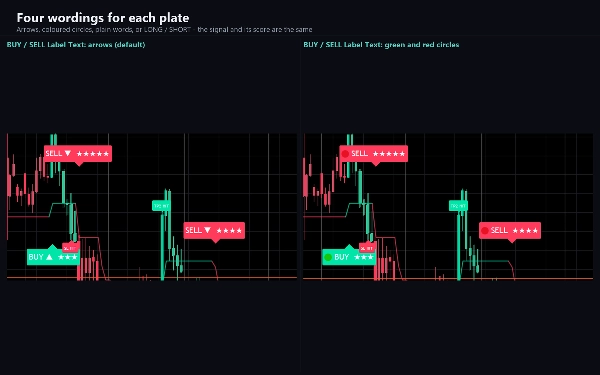
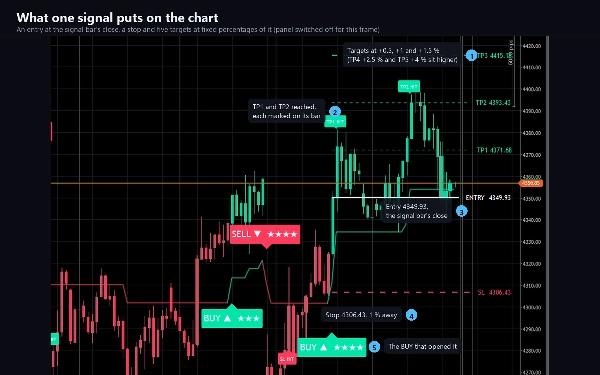
- Eine Platte auf jeder Signal-Kerze – KAUF unter der Kerze, VERKAUF darüber – mit ein bis fünf Sternen. Ruhen Sie den
Zeiger auf einer Platte, um deren Bewertung, Einstieg, Stop und alle fünf Ziele zu sehen.
- Für das offene Signal: eine Einstiegs-Linie, ein Stop und fünf Ziele, jeweils mit einem Preisschild. Ein kleines Label
markiert jedes erreichte Ziel und den Stop, wenn dieser erreicht wird.
- Kleine Diamanten an Momentum-Extremen: unter der Kerze, wenn ein langsamer RSI stark überverkauft und noch
schwächer wird, über der Kerze, wenn er überkauft und noch stärker wird.
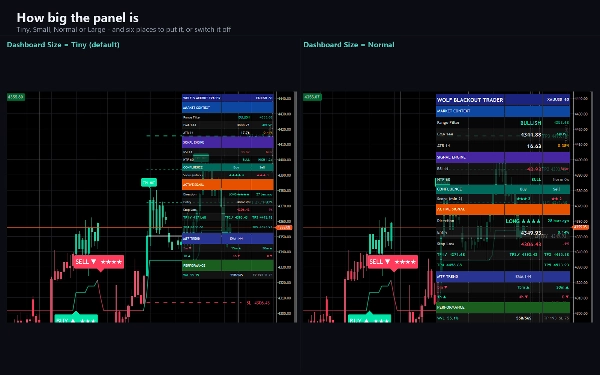
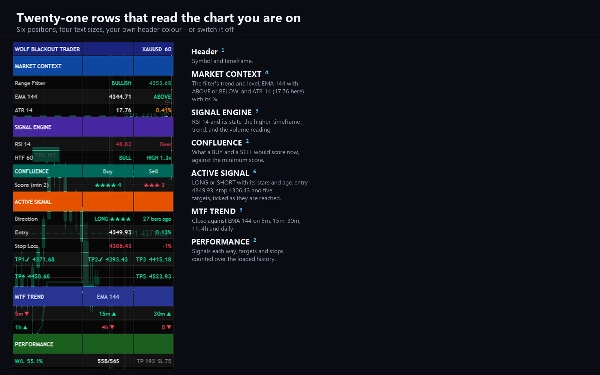
- Ein einundzwanzig-zeiliger Panel: der Marktkontext (Trend, EMA, ATR), die Signalmotor (RSI, die
Höherzeitrahmen-Lesung und die Volumen-Lesung), die Bewertung, die ein KAUF und ein VERKAUF gerade jetzt erhalten würden,
das aktive Signal mit seinem Einstieg, Stop und Zielen, die abgehakt werden, sobald sie erreicht sind, ein Trendblock für sechs
Zeitrahmen von fünf Minuten bis täglich, und eine laufende Zählung von Signalen, Zielen und Stops.
WIE ES ENTSCHEIDET
Der Filter bewegt sich nur, wenn der Preis einen Bereich um ihn verlässt. Sein Bereich ist der Durchschnitt eines schnellen und eines langsamen
geglätteten Bereichs, sodass er kleine Störungen ignoriert und echten Bewegungen folgt. Ein KAUF-Auslöser ist die erste Kerze, die
nach einer bärischen Phase bullisch wird, und ein VERKAUF-Auslöser das Gegenteil.
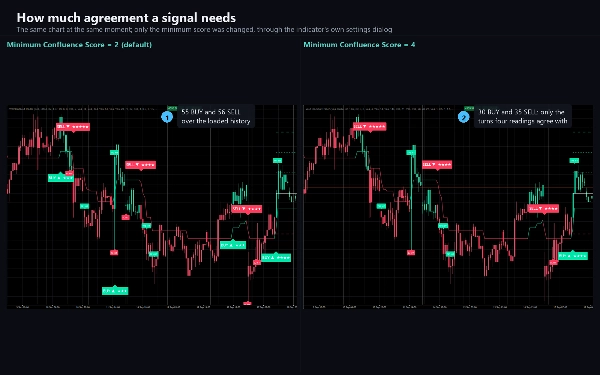
Jeder Auslöser erhält einen Punkt, plus einen für jede Ebene, die zustimmt: RSI auf der richtigen Seite von 50, Schlusskurs
auf der richtigen Seite eines 144 EMA, derselbe EMA-Test auf einem von Ihnen gewählten höheren Zeitrahmen (standardmäßig eine Stunde), und ein Volumenanstieg über seinem 20-Kerzen-Durchschnitt. Ein Auslöser wird zu einem Signal, wenn er die
Mindestpunktzahl erreicht (standardmäßig zwei) und seit dem letzten Signal in diese Richtung genügend Kerzen vergangen sind.
Standardmäßig wird ein Signal entschieden, wenn seine Kerze schließt. Eine Ebene, die Sie ausschalten, fügt immer ihren Punkt hinzu.
Der Stop und die fünf Ziele sind feste Prozentsätze des Einstiegspreises, alle anpassbar. Das Erreichen des
fünften Ziels schließt den Trade als Gewinn ab. Der Stop schließt ihn als Gewinn, wenn das erste Ziel vorher erreicht wurde,
ansonsten als Verlust. Ein neues Signal ersetzt das offene.
WICHTIGE EINSTELLUNGEN
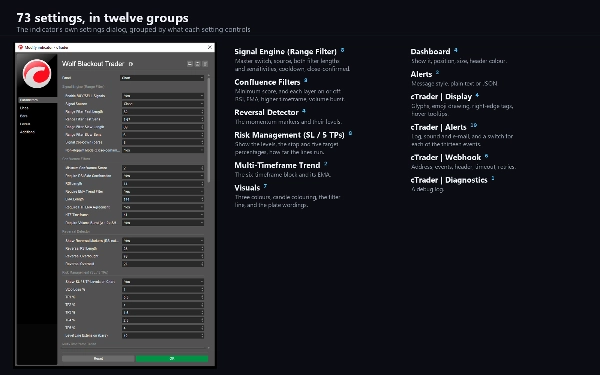
73 in zwölf Gruppen: die Signalquelle, beide Filterlängen und Empfindlichkeiten, die Abkühlzeit und der
Close-Confirmed-Modus; die Mindestpunktzahl, jede Konfluenz-Ebene an oder aus, die RSI- und EMA-Längen und
der höhere Zeitrahmen; die Momentum-Marker und ihre Levels; die Stop- und fünf Zielprozentsätze und
wie weit die Level-Linien reichen; die EMA-Länge des Trendblocks; drei Farben, Kerzenfärbung, die Filterlinie
und vier Beschriftungen für jede Platte; die Position, Größe und Kopfzeilenfarbe des Panels; der Alarmnachrichtenstil;
und Gruppen für Anzeige, Alarme, Webhook und Diagnostik.
ALARME UND WEBHOOK
Dreizehn Ereignisse, jeweils mit eigenem Schalter: KAUF, VERKAUF, eines der beiden Signale, ein fünf-Sterne-KAUF oder -VERKAUF, jeder
Momentum-Marker, jedes der fünf Ziele und der Stop. Geliefert als cTrader-Protokollzeile, ein Ton Ihrer Wahl und E-Mail. Ein Signalalarm enthält den Einstieg, den Stop, alle fünf Ziele und die Bewertung.
Nichts wird ausgelöst, während der Indikator die Chart-Historie durchläuft, und nichts wird in einem Backtest ausgelöst.
Ein Webhook sendet Signale – und, falls gewünscht, Ziele, Stop und Marker-Ereignisse – als JSON an jede von Ihnen eingegebene Adresse: einen Trading-Bot, ein Journal, ein Relay, einen Automatisierungsfluss. Er bleibt aus, bis Sie eine eingeben, wird pro Ereignis pro Kerze dedupliziert, auf zwanzig Nachrichten pro Minute begrenzt, und ein Fehler wird protokolliert statt geworfen. Er sendet über den eigenen Netzwerkdienst von cTrader, weshalb der Indikator keine Datei- oder Netzwerkzugriffsrechte benötigt.
TYP UND FENSTER
Ein Overlay-Indikator: alles wird auf dem Preischart gezeichnet, und es wird kein separates Fenster hinzugefügt.
ZEITRAHMEN UND INSTRUMENTE
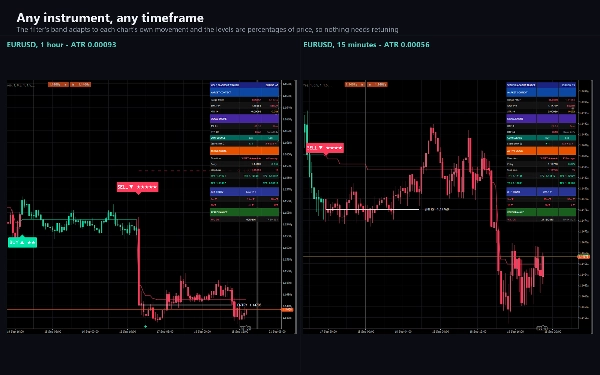
Jeder zeitbasierte Zeitrahmen und jedes Instrument. Der Bereich passt sich an die Bewegung jedes Charts an, die Levels sind Prozentsätze des Preises, und Preise werden nach dem Tick Ihres Brokers formatiert. Der Indikator lädt die anderen Zeitrahmen, die er liest, selbstständig.
ANWENDUNGSFÄLLE
- Den Trend eines beliebigen Charts anhand der Farbe seiner Kerzen ablesen.
- Nur Wendungen nehmen, denen mehrere unabhängige Lesungen zustimmen.
- Jedes Signal in einen Plan verwandeln: einen Stop und fünf Ziele, im Voraus gezeichnet.
- Sechs Zeitrahmen gleichzeitig im Panel prüfen.
- Per Protokollzeile, Ton, E-Mail oder Webhook benachrichtigt werden, wenn ein Signal ausgelöst oder ein Ziel erreicht wird.
FÜR WEN ES GEEIGNET IST
Trader, die klare Kauf- und Verkaufspunkte mit einem dahinterliegenden Trendfilter wünschen, und alle, die ein Signal mit einem Stop und einer Zielleiter statt einem Pfeil erhalten möchten.
TESTVERSION
Die kostenlose Testversion ist der vollständige Indikator nur für EURUSD – jeder Broker-Suffix funktioniert. Bei jedem anderen Symbol zeigt sie eine Meldung und zeichnet nichts. Keine Zeitbegrenzung, keine reduzierte Historie, keine fehlenden Funktionen. Die Vollversion entfernt die Symbolbeschränkung und ändert sonst nichts.
TECHNISCHE HINWEISE UND EINSCHRÄNKUNGEN
Zugriffsrechte: keine. Der Indikator kann keine Dateien lesen, keine Prozesse starten oder eigene Verbindungen öffnen.
Es ist ein Chart- und Analysewerkzeug. Es platziert keine Orders und hat keinen Zugriff auf Ihr Konto.
Die Volumen-Ebene liest das Tick-Volumen Ihres Brokers, sodass sie bei einem anderen Feed unterschiedlich entscheiden kann, ob eine Wendung die Mindestpunktzahl erreicht. Die Höherzeitrahmen-Ebene liest die sich entwickelnde Höherzeitrahmen-Kerze, während das Chart läuft, und abgeschlossene Kerzen nach dem Neuladen des Charts, sodass sich ein Signal aus einer Live-Session nach einem Neuladen verschieben kann. Ziel- und Stop-Überprüfungen sowie die Momentum-Marker aktualisieren sich, während die Kerze sich bildet. Der Filter stabilisiert sich über die ersten paar hundert Kerzen eines Charts, laden Sie also etwas Historie, bevor Sie seine frühesten Signale lesen.
Die PERFORMANCE-Zeile des Panels zählt, was die gezeichneten Levels an den geladenen Kerzen Ihres Charts getroffen haben. Ein Stop, der nach dem ersten Ziel erreicht wird, zählt als Gewinn, und ein Signal, das durch das nächste ersetzt wird, wird nicht gezählt. Es ist eine Beschreibung dieser Historie, kein Backtest und keine Prognose.
SUPPORT
Fragen gehen über den Diskussionstab. Geben Sie Ihren Broker, das Symbol, den Zeitrahmen, die cTrader-Version und
einen Screenshot des gesamten Charts an, und Sie erhalten beim ersten Mal eine hilfreiche Antwort.
Trading beinhaltet Risiken. Vergangene Performance garantiert keine zukünftigen Ergebnisse.
Zusammenfassung
Each signal includes a defined entry, adjustable stop loss, and five profit targets, visually marked on the chart with price tags and a star rating indicating signal strength. Momentum extremes are highlighted with markers based on RSI conditions. A comprehensive 21-row panel displays market context, signal engine status, active signals with progress, multi-timeframe trend blocks, and cumulative counts of signals and targets.
The indicator supports customizable alerts via log lines, sounds, email, and JSON webhooks for integration with external tools. It requires no special access rights and does not place orders. Settings cover signal sources, filter parameters, scoring layers, target levels, colors, display options, and alert configurations. The tool is intended for traders seeking clear, scored buy/sell signals backed by multiple technical confirmations and a structured trade plan.
Kundenbewertungen
5 | 100 % | |
4 | 0 % | |
3 | 0 % | |
2 | 0 % | |
1 | 0 % |













![„[Stellar Strategies] MARSI Signal Plotter“-Logo](https://cdn.ctrader.com/image/webp/7b2b8da6-8f8e-4646-8d4a-4710c516c01e_25567)













