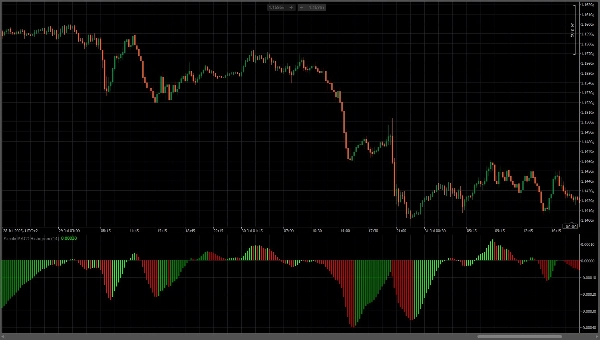
Simple MACD Histogram
Logotipo de "Simple MACD Histogram"
03/08/2025
46
Desktop
Since 15/06/2025
Free installs
156
Imagen cargada de "Simple MACD Histogram"

This custom MACD Histogram indicator displays the MACD histogram with enhanced visual clarity styling. The indicator uses a fast EMA period of 14, automatically calculates the slow EMA as fast plus 2 (16). The indicator features highly contrasted color-coding for instant trend recognition: bright green bars indicate rising momentum (bullish), while red bars show falling momentum (bearish). The histogram bars extend symmetrically from a center zero line, creating an intuitive visual representation where green signals buy pressure and red signals sell pressure. This visualization style provides clear, unambiguous momentum signals and helps identify potential trend reversals and momentum shifts in price action.

Más de este autor
Flex VWAP
Flexible VWAP indicator with timezone-aware, custom time periods and automatic DST handling.
Puede interesarle
ScalperSignalVisual
Overview of the Fade Breakout Visualizer Indicator
Indicador
ATR
Forex
RISK V1
Automated position sizing based on risk, entry, and stop loss with ATR support and visual trade setup on charts.
Indicador
NAS100
NZDUSD
XAUUSD
+14
WVAP-Bands Indicator_noSourceCode
VWAP with standard deviation bands. Fully customizable colors, periods, and multipliers for precise trading signals
Candles_Painter
Overlay HTF context on any chart: color bars by HTF and draw filled HTF bodies with optional High/Low lines.
Quantitative Qualitative Estimation
The QQE (Quantitative Qualitative Estimation) Weighted Oscillator improves its original version by weighting the RSI.
Market Sessions Advanced
Advanced Market Sessions with ICT killzones
Time To Break Even Indicator v2
Time To Break Even Indicator. This indicator helps you time your trade's entry.
Indicador
Signal
DARK POLL SIGNAL_noSourceCode
Dark Poll Signal Indicator.liquidity leakage,precedes the great movement, accumulation, distribution
Coloring Trendline with arrows
Coloring trendline/ Colored Trendline / Color Trendline
DEnvelopSystem
DEnvelop is a high-performance trading indicator engineered for scalpers and intraday strategists who demand precision.
Indicador
Stocks
Forex
MACD
MACDVolume
😎Read the description before purchasing💩
Indicador
VWAP
Indices
Commodities
+1
vwap
Custom VWAP Indicator for cTrader
Indicador
Indices
MFI-MTF
Multi-timeframe Money Flow Index
E7 Volume Profile
E7 Volume Profile, more modern look and feel.
Indicador
Breakout
AI
Scalping
KaufmanEfficiencyRatio
A precision tool for measuring how efficiently price moves from point A to B.
Indicador
NAS100
Indices
NZDUSD
+9
RT Relative Moving Average
Bring the RMA to cTrader! This is the Relative Moving Average from TradingView.
[Hamster-Coder] Price
Indicator designed to calculate and manipulate price inputs (sources) in real time
Price Speed or Acceleration v1
This Indicator will display either the speed or the acceleration of the current symbol.