Descripción
▁▂▃▄▅▆▇ █ 10,000+ traders (institutional + retail) █ ▇▆▅▄▃▂▁
- Elija nuestros mejores indicadores en cTrader 🏆
- ✨ Precisión exclusiva para resultados superiores ✨
- 📈 Nuestros algoritmos —con los visuales mejor valorados 🎯—
- han sido implementados con éxito en 2 fondos cuantitativos
▁▂▃▄▅▆▇ █████████████████████████████ ▇▆▅▄▃▂▁
_______________________________________________
_______________________________________________
📌 Indicadores de Estructura de Mercado
· ✅ AdvancedMarket Structure: Bos, Choch, SwinLevels, Order Blocks, Market Structure& Liquidity Finder
· 🔄 Dynamic Market StructureAnalysis of Turning Points
· 🧱 Order Block
· ⚖️ Market Imbalance
· ⛓️ BOS & CHOCH
· 🧠 ICT Power of 3
______________________________________________________________-
Store cBots : 🧠 Gold & BTC BreakoutSession Pivots 🧠
_______________________________________________
🔚 Sistemas Inteligentes de Salida
· 📍 Algoritmo Inteligente de Seguimiento
_______________________________________________
📐 Indicadores ZigZag
· 🔍 Proyección de Liquidez de Precio ZigZag
· ➖ ZigZag
· 🎯 Rastreador de Extremos Zig-Zag
_______________________________________________
🧱 Indicadores de Soporte y Resistencia
· 🟩 Líneas de Soporte y Resistencia SmartTrend
· 🧱 Todos los Niveles de Soporte y Resistencia
_______________________________________________
📊 Indicadores de Tendencia y Canal
· 🔄 Canal de Tendencia Automático
· 📊 Supertrend
· ⚡Analizador de Tendencia Momentum
· 🧠 Canal de Tendencia Adaptativo
· 💥 Sistema de Ruptura de Canal
· 🌈 Gradiente de Tendencia Dinámico
_______________________________________________
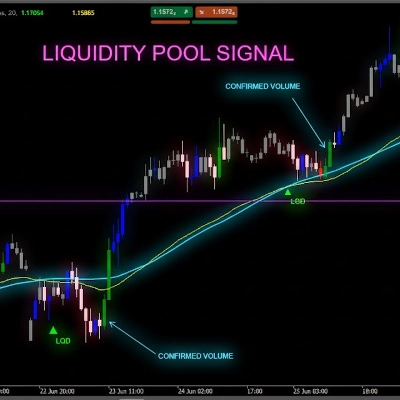
💧 Herramientas de Volumen y Liquidez
· 📉 Mapa de Liquidación de Apalancamiento
· 🔍 Brecha de Valor Justo Momentum
· 🕒 Sesiones de Brecha de Valor Justo
_______________________________________________
⚡ Indicadores de Momentum y RSI
· 📈 Disparador de Tendencia RSI
· 🚀 Momentum de Rango Dinámico
· 🔎 Rastreador de Sesgo de Vela Multi-Nivel
_______________________________________________
🔮 Herramientas de Predicción y Proyección
· 📐 Predicción Basada en Linreg& ATR
· 📏 Regresión Lineal FibonacciMulti-temporal
· 📈 Proyector de Flujo de Mercado Potenciado por Volumen
______________________________________________________________________________________________________
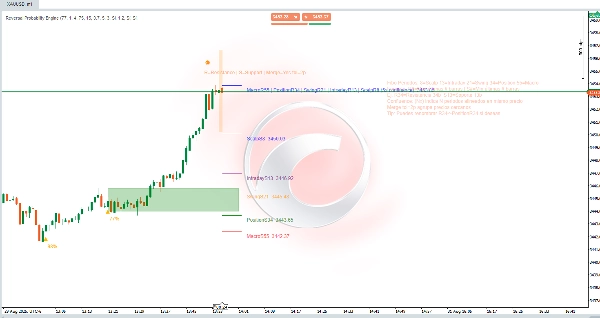
MOTOR DE PROBABILIDAD DE REVERSIÓN 🔄
Un indicador híbrido para detectar zonas de reversión + mapeo multidimensional de soportes y resistencias "Niveles Dorados". Combina análisis de estructura (máximos/mínimos de ventana Fibonacci), dinámica (velocidad y aceleración del precio), entropía/caos (orden vs. desorden), momentum y volumen para generar:
- Niveles jerárquicos de soporte/resistencia por horizonte temporal.
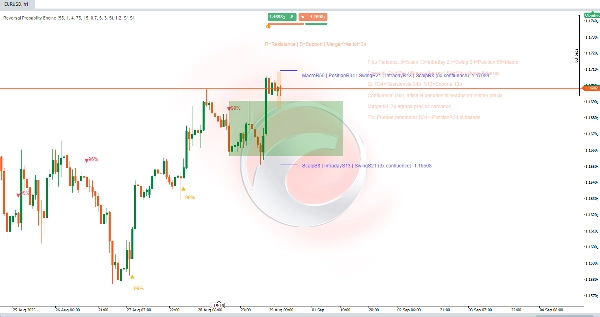
- Señales probabilísticas de posible reversión (picos y valles) con un % de confianza. ⚠️
- Zonas activas (rectángulo) para contextualizar operaciones y stops.
- Clusters de confluencia (cuando múltiples marcos temporales coinciden en el mismo precio). 🎯
2. Objetivo
Reducir el ruido visual y facilitar la toma de decisiones identificando:
- Dónde el precio ha sido comprimido o anclado a través de varios horizontes.
- Dónde aumenta la probabilidad estadística de una reversión (confirmada o anticipada). 📊
- Qué niveles tienen mayor "peso" (confluencia).
3. Lógica Conceptual
a) Niveles: Para cada ventana Fibonacci, se toman el máximo reciente (R) y el mínimo (S); esto proporciona una escala fractal de contextos (ultra-corto a macro).
b) Fusión: Si varios niveles distintos caen dentro de X pips, se agrupan → un cluster con etiqueta combinada y conteo de confluencia.
c) Señales de Reversión: Se buscan patrones locales de agotamiento (forma de onda), desaceleración (cambio de pendiente), caída de baja entropía (baja entropía = movimiento más direccional predispuesto a revertir), posibles divergencias internas y validaciones de momentum/volumen.
d) Modo Predictivo: Permite anticipar reversión (diamante) antes de la confirmación completa si se alinean aceleración contraria + baja entropía + estado extremo. 💎
e) Probabilidad: Ponderación normalizada de varios factores (tendencia, caos, momentum, volumen, divergencia, adaptación). Resultado truncado 40–99%.
f) Zona Activa: Después de una señal, se busca el rango más lógico (entre niveles relevantes) para gestionar la operación y contextualizar stops.
4. Componentes Visuales
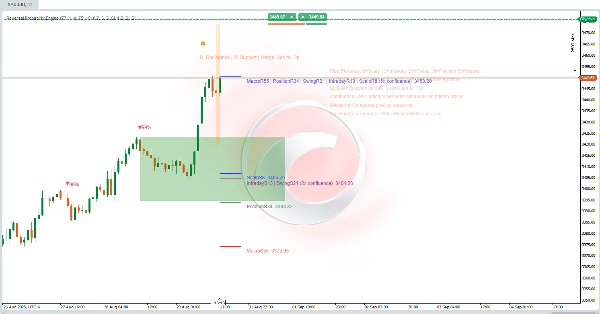
- Líneas horizontales: Niveles por periodo (Scalp 8, Intraday 13, Swing 21, Position 34, Macro 55). Color consistente por horizonte.
- Etiquetas R#/S#: R = Resistencia (máximo reciente de esa ventana), S = Soporte (mínimo reciente). Ej.: R34 = resistencia derivada de las últimas 34 velas.
- Etiquetas fusionadas:
ScalpS8 | IntradayS13 | … (5x confluencia) Precio. Indica que N periodos distintos arrojan el mismo nivel (o dentro de la tolerancia). Cuantos más, mayor relevancia. ✅ - (Nx confluencia): Número de periodos coincidentes.
- Tolerancia de fusión=Xp: Tolerancia en pips que agrupa niveles cercanos (evita saturación).
- Probabilidades (%): Texto arriba/abajo de triángulos (Abajo / Arriba) o diamante (detección temprana).
- Rectángulo verde (zona activa): Canal operativo dinámico donde se evalúa la evolución post-señal.
- Bloques/colores adicionales sutiles: Elementos de soporte (ondas/partículas) si están activados.
5. Interpretación Práctica
- Alta confluencia (≥3x) = fuerte "imán" o nivel pivote; observe la reacción del precio. 🧲
- Señal + confluencia cercana refuerza la validez (pero no garantiza).
- Probabilidad ≥ % Confianza Mínima: Filtro mínimo para considerar acción.
- Diferenciar Anticipado (diamante) vs. Confirmado (triángulo): El anticipado ofrece mejor riesgo/recompensa, mayor tasa de falsos; el confirmado llega con menos asimetría pero más validación.
- Rectángulo: Si el precio permanece dentro y no invalida el borde opuesto, la tesis sigue vigente; una ruptura limpia reduce la expectativa.
- Expandir o disminuir Tolerancia de Fusión: Menor = mayor granularidad, Mayor = clusters más sintetizados.
6. Flujo de Uso
- Cargue el indicador en el instrumento y marco temporal deseados.
- Ajuste el % de Confianza Mínima según la tolerancia (p. ej., menor para scalping, mayor para swing).
- Verifique si aparece un cluster múltiple de soporte/resistencia (5x, 4x, etc.).
- Espere una señal (ideal si surge en la periferia del cluster y con alta probabilidad). 🔔
- Delimite la gestión dentro de la zona activa: entrada escalonada o confirmación de ruptura fallida.
- Defina un stop lógico: más allá del primer nivel inferior (en largo) o superior (en corto) no presente en la confluencia.
- Desactive los periodos que no use (p. ej., solo Swing/Macro para posiciones largas).
- Ajuste la tolerancia y, opcionalmente, oculte el panel explicativo una vez aprendido.
7. Ejemplo Rápido de Lectura de Etiqueta
ScalpS8 | IntradayS13 | SwingS21 | PositionS34 | MacroS55 (5x confluencia)
Significado: Todos los marcos temporales (8–55) comparten el mismo piso → soporte estructural multi-escala. Mayor probabilidad de reacción; si se pierde con volumen, implica un cambio de régimen más serio. 🚨
Resumen
Key features include:
- Hierarchical support and resistance levels categorized by time horizons (from ultra-short scalp to macro scales).
- Probabilistic reversal signals indicating potential peaks and valleys with confidence percentages.
- Active zones displayed as rectangles to help contextualize trade entries and stop placements.
- Confluence clusters that highlight price levels confirmed across multiple timeframes, enhancing level significance.
The indicator reduces visual noise by grouping nearby levels within a tolerance range and provides clear visual components such as horizontal lines, labeled resistance/support points, merged confluence labels, probability percentages, and active zones. It distinguishes between anticipated and confirmed reversal signals, offering traders options for risk management and trade timing.
Users can adjust confidence thresholds and merge tolerances to tailor granularity and filtering according to their trading style and timeframe. The tool supports structured decision-making by identifying statistically significant reversal areas and multi-scale support/resistance clusters on any instrument and timeframe.
Valoraciones de clientes
5 | 0 % | |
4 | 0 % | |
3 | 0 % | |
2 | 0 % | |
1 | 100 % |