
Rsi + Volume
インジケーター
707 ダウンロード数
バージョン 1.0、Mar 2025
Windows、Mac
5.0
レビュー: 3
説明
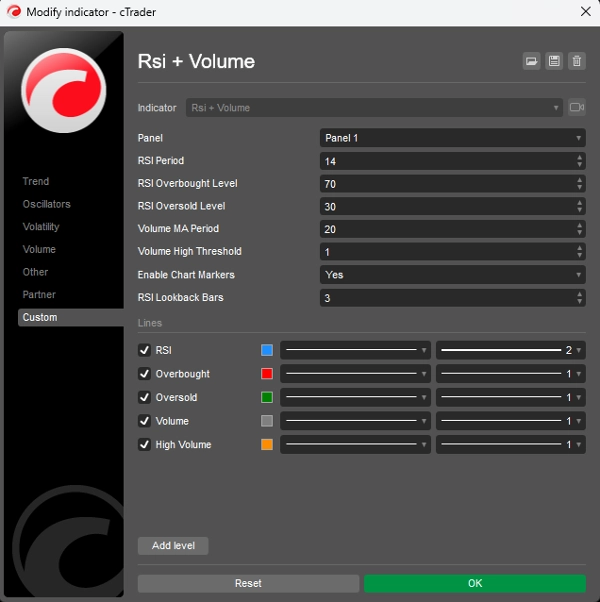
このインジケーターはRSI(相対力指数)と出来高分析を組み合わせて、より信頼性の高い取引シグナルを生成します。重要な価格変動は、その動きの強さを確認するために高い出来高を伴うべきだという原則に基づいています。
主要な構成要素:
- RSI分析:
-
- 価格変動の速度と変化を0〜100のスケールで測定する
- 買われ過ぎ状態(70以上)と売られ過ぎ状態(30以下)を識別する
- 市場の潜在的な反転ポイントを見つけるのに役立つ
- 出来高分析:
-
- 現在の出来高を最近の出来高の移動平均と比較する
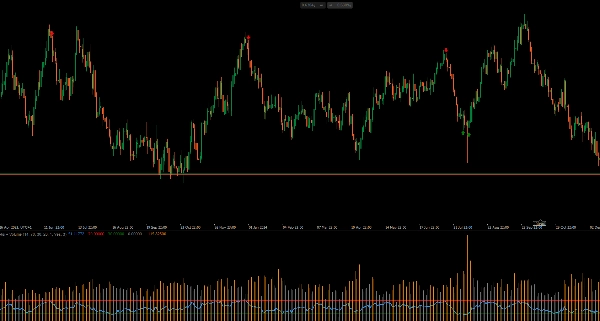
- 高出来高の期間を強調表示(オレンジ色のヒストグラムバー)
- 価格変動の背後にある強さを確認する
- シグナル生成:
-
- 買いシグナル:RSIが売られ過ぎレベル(30)を上回り、高出来高の場合
- 売りシグナル:RSIが買われ過ぎレベル(70)を下回り、高出来高の場合
- 視覚的なシグナルがチャート上に直接表示される(買いは緑の上向き矢印、売りは赤の下向き矢印)
使い方:
- 価格が下降トレンドにあり、RSIが売られ過ぎ状態を示しているときに買いシグナルを探す
- 価格が上昇トレンドにあり、RSIが買われ過ぎ状態を示しているときに売りシグナルを探す
- 高い出来高がシグナルの強さを確認する
- パラメーター(RSI期間、出来高の閾値)を取引の時間枠に合わせて調整する
このインジケーターは、RSIの確認と平均以上の出来高の両方を必要とすることで誤ったシグナルを除外し、RSI単独よりも信頼性を高めます。
概要
AIによる概要
The "Rsi + Volume" indicator integrates the Relative Strength Index (RSI) with volume analysis to enhance the reliability of trading signals. It operates on the principle that significant price movements should be confirmed by high trading volume.
Key components include:
1. RSI Analysis:
- Measures the speed and change of price movements on a 0-100 scale.
- Identifies overbought conditions (above 70) and oversold conditions (below 30).
- Helps detect potential market reversal points.
2. Volume Analysis:
- Compares current volume against a moving average of recent volume.
- Highlights periods of high volume using orange histogram bars.
- Confirms the strength behind price movements.
Signal generation occurs when RSI crosses key thresholds with accompanying high volume:
- Buy signals trigger when RSI rises above the oversold level (30) with high volume.
- Sell signals trigger when RSI falls below the overbought level (70) with high volume.
Visual signals appear directly on the chart as green up arrows for buys and red down arrows for sells.
Users can adjust parameters such as RSI period and volume threshold to fit their trading timeframe. This indicator aims to filter out false signals by requiring both RSI confirmation and above-average volume, providing more dependable trade signals than RSI alone.
インジケーターのプロフィール
カスタマーレビュー
5.0
レビュー: 3
5 | 100 % | |
4 | 0 % | |
3 | 0 % | |
2 | 0 % | |
1 | 0 % |
カスタマーレビュー
October 12, 2025
Hello, the RSI +volume indicator is perfect, but it needed to have something: when the little arrow appears on the chart, it could show a notification or an alarm. Would you be able to add that alarm or notification in cTrader?
August 12, 2025
Pros: Combines RSI and volume for stronger trading signals. Works well when RSI threshold intersects with high volume spikes. Lightweight and clear visuals. Cons: No alerts or tooltips. Lacks template saving. May generate noise on low-volume timeframes without additional filters.
ディスカッション
よくあるご質問
Signal
Indices
RSI
cTrader Storeで入手可能な取引ボット、インジケーター、プラグインなどの商品は、第三者の開発者が提供するものであり、情報と技術の取得のみを目的としてご利用いただけます。cTrader Storeはブローカーではなく、投資助言や個人的な推奨を行うことも、将来のパフォーマンスを保証することもありません。


価格
登録日 21/02/2025
466.3M
取引数量
180.83K
獲得pips
22
販売
6.9K
無料インストール