
Beschreibung
Pinescriptlabs Store Indikatoren: Pinescriptlabs Store cBots : (cBot) Gold & BTC BreakoutSession Pivots(neu)
Vorhersage basierend auf Linreg & ATR
SmartTrend Unterstützung &
Widerstand
Linien
Dynamische
Marktstruktur
Analyse
von
Wendepunkten
Punkten
Fibonacci
Lineare
Regression
Multi-Timeframe
Multi-Level
Kerzen-Bias
Tracker
Reaktive gleitende Durchschnitt
Auto
Unterstützung und
Widerstand
Trend
Linien
Alle
Unterstützungs- und
Widerstandsniveaus
Levels
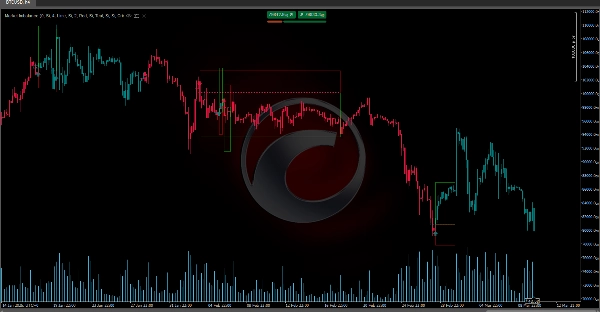
MarketImbalanceDetector identifiziert Marktungleichgewichte und markiert visuell Schlüsselbereiche basierend auf Preis-Mustern und Volatilität (ATR). Hier ist eine einfache Erklärung, wie es funktioniert:
🔍 Signal-Erkennung
Es vergleicht die Preise vorheriger Balken, um bullische oder bärische Muster zu erkennen. Durch die Verwendung spezifischer Bedingungen (wie den Vergleich von Tiefs und Hochs vorheriger Balken) und das Filtern von Signalen mit der aktuellen Volatilität stellt es sicher, dass die Bewegung signifikant ist.
📊 Visualisierung von Ungleichgewichten
Wenn ein Signal erkannt wird, zeichnet der Indikator auf dem Chart:
- Einen Ungleichgewichtsbereich (ein Rechteck), das die Zone markiert, in der das Muster auftrat.
- Eine Durchschnittliche Linienebene (berechnet aus relevanten Hochs und Tiefs), um Unterstützung oder Widerstand zu visualisieren.
- Ein Symbol (ein Pfeil), der die Signale Richtung anzeigt (⬆️ für bullisch, ⬇️ für bärisch).
OP/PE Zonen
Zusätzlich erstellt es Zonen namens OP () und PE (Escape Point). Diese Zonen werden berechnet, indem ein Vielfaches des ATR zum Durchschnittsniveau addiert oder subtrahiert wird, um Bereiche für Gewinnmitnahmen oder Verlustbegrenzungen zu definieren.
Zusammenfassung
When a signal is detected, the indicator visually marks the chart with:
- An Imbalance Area (a rectangle) highlighting the zone where the pattern occurred.
- An Average Level Line calculated from relevant highs and lows to indicate potential support or resistance.
- An Icon (arrow) showing the signal direction: upward for bullish and downward for bearish.
Additionally, the indicator calculates OP (Order Point) and PE (Escape Point) zones by adding or subtracting multiples of ATR to the average level. These zones assist traders in defining areas for taking profit or cutting losses.
This tool supports analysis across various markets including cryptocurrencies (e.g., BTCUSD), commodities (e.g., XAUUSD), and integrates concepts related to breakout strategies, trend indicators like Supertrend, and momentum measures such as RSI. It is intended to enhance market structure understanding and assist in decision-making by visually representing key imbalance zones on trading charts.


