
Opis
Przegląd
MarketStructurePro jest profesjonalnym wskaźnikiem wykrywania swingów, który automatycznie identyfikuje i klasyfikuje kluczowe punkty zwrotne rynku za pomocą analizy fraktalnej. Wyróżnia cztery podstawowe typy swingów: Wyższe Szczyty (HH), Wyższe Dołki (HL), Niższe Szczyty (LH) oraz Niższe Dołki (LL).
Działa na wszystkich instrumentach (Forex, Crypto, Indeksy, Surowce) i ramach czasowych.
Jak to działa
Wskaźnik analizuje dane dotyczące ruchu cen (High, Low, Close), aby wykryć istotne punkty swingowe za pomocą matematyki fraktalnej. Ocena lokalnych szczytów i dołków, porównywanie kolejnych swingów w celu określenia kierunku trendu oraz identyfikacja zmian struktury rynku, gdy wzorce swingów ulegają zmianie.
Działa skutecznie w:
- Rynkach trendowych - identyfikuje wzorce kontynuacji
- Rynkach bocznych - definiuje poziomy wsparcia/oporu
- Rynkach zmiennych - podkreśla kluczowe punkty zwrotne
- Wszystkich ramach czasowych - od wykresów 1-minutowych do miesięcznych
Interpretacja sygnałów
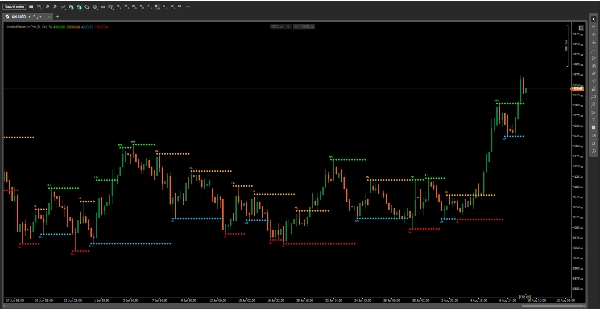
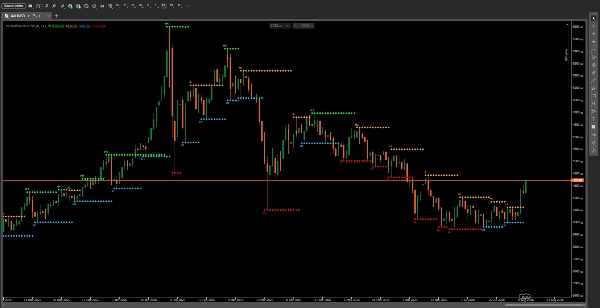
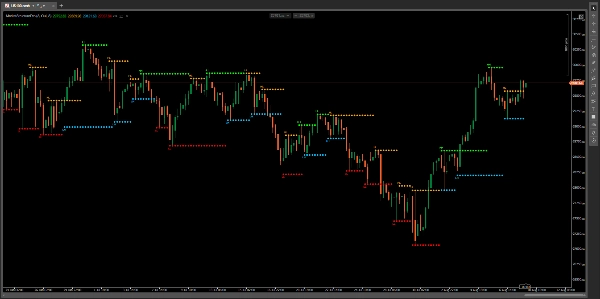
Wskaźnik wyświetla 4 punkty kodowane kolorami bezpośrednio na wykresie:
Wyższy Szczyt (HH) - Zielony limonkowy
Nowy szczyt wyższy niż poprzedni. Wskazuje na kontynuację trendu wzrostowego i wzmacniający się trend wzrostowy.
Wyższy Dołek (HL) - Pomarańczowy
Nowy dołek wyższy niż poprzedni. Wskazuje na strukturę byczą z rosnącym wsparciem.
Niższy Szczyt (LH) - Głęboki błękit nieba
Nowy szczyt niższy niż poprzedni. Wskazuje na strukturę niedźwiedzią z oporem przesuwającym się w dół.
Niższy Dołek (LL) - Czerwony
Nowy dołek niższy niż poprzedni. Wskazuje na kontynuację trendu spadkowego i wzmacniający się trend spadkowy.
Odczyt struktury rynku:
- HH + HL rosnące = Silny trend wzrostowy
- LH + LL malejące = Silny trend spadkowy
- Nieudany HH, po którym następuje LH = Potencjalne odwrócenie niedźwiedzie
- Nieudany LL, po którym następuje HL = Potencjalne odwrócenie bycze
Kluczowe ustawienia
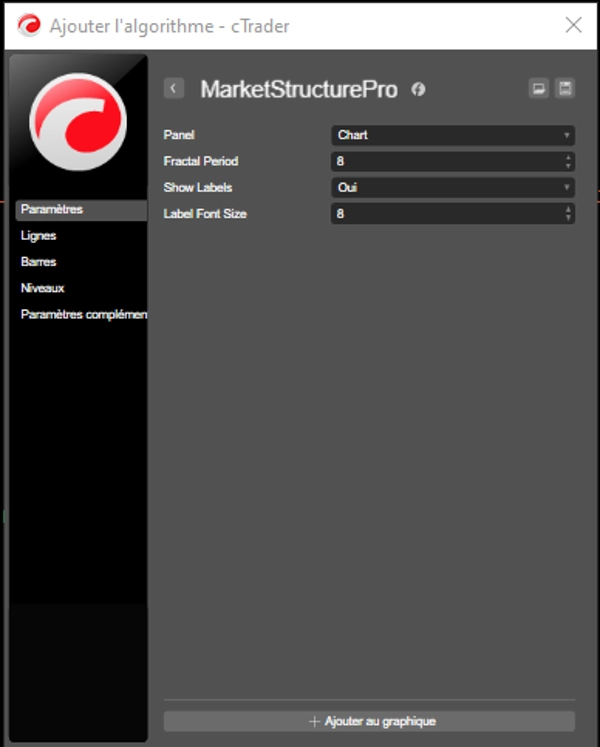
Okres fraktala (domyślnie: 8)
Liczba świec używanych do identyfikacji punktów swing. Wyższe wartości generują mniej, ale bardziej znaczących swingów. Niższe wartości generują więcej sygnałów dla wcześniejszego wykrywania.
Pokaż etykiety (domyślnie: prawda)
Przełączanie etykiet tekstowych (HH/HL/LH/LL) włącz/wyłącz dla czytelniejszych wykresów.
Rozmiar czcionki etykiety (domyślnie: 8)
Dostosuj rozmiar etykiet swingów dla lepszej widoczności.
Sugerowane okresy:
- Okres 5-7: Day trading i skalpowanie
- Okres 8-12: Swing trading
- Okres 14-20: Trading pozycyjny
Scenariusze handlowe
Podążanie za trendem
Identyfikuj istniejący trend za pomocą wzorców HH/HL lub LH/LL. Wchodź na korekty do HL (trend wzrostowy) lub LH (trend spadkowy). Ustaw stop loss poniżej ostatniego HL lub powyżej ostatniego LH. Celuj w następny HH lub LL.
Trading wybicia
Obserwuj, jak cena zbliża się do poprzedniego HH lub LL. Wchodź, gdy cena przebije HH (long) lub przebije LL (short). Ustaw stop loss poniżej świecy wybicia lub najbliższego punktu swingowego.
Wykrywanie odwrócenia
Obserwuj nieudane wybicia. HH, po którym następuje LH, wskazuje na potencjalne odwrócenie niedźwiedzie. LL, po którym następuje HL, wskazuje na potencjalne odwrócenie bycze.
Wsparcie i opór
Używaj HH i LL jako kluczowych poziomów. Rysuj linie poziome dla wejść i wyjść. Kupuj przy wsparciu HL, sprzedawaj przy oporze LH.
Koncepcje Smart Money (SMC)
Identyfikuj Break of Structure (BoS) i Change of Character (ChoCh). Wchodź na przerwania struktury ze stopami poza ostatnim punktem swingowym.
Dla kogo jest to przeznaczone?
Idealne dla:
- Traderów Price Action
- Traderów SMC (Smart Money Concept)
- Podążających za trendem
- Traderów swingowych
- Traderów dziennych
Poziom doświadczenia:
Odpowiedni dla wszystkich poziomów - od początkujących do zaawansowanych. Wizualny i łatwy do zrozumienia dla nowych traderów, a jednocześnie zapewnia profesjonalną analizę struktury dla doświadczonych traderów.
Ważne ograniczenia
Wskaźnik opóźniony
Fraktale są identyfikowane po ich uformowaniu, wymagając potwierdzenia 2 świecami. Sygnały są reaktywne, a nie predykcyjne.
Mniej skuteczny na rynkach bocznych
Może generować częste sygnały w warunkach bocznych. Użyj wyższego okresu fraktala, aby zmniejszyć szumy.
Może przegapić gwałtowne ruchy
Ekstremalna zmienność może tworzyć swingi, które omijają wykrywanie fraktali.
Uwagi dotyczące użytkowania:
- Zawsze używaj konfluencji z innymi wskaźnikami
- Struktura na wyższych ramach czasowych jest bardziej znacząca
- Nie każdy punkt swingowy jest sygnałem handlowym
- Dostosuj okres w zależności od zmienności rynku
- Zawsze najpierw przeprowadzaj testy historyczne
Zastrzeżenie
Wyniki z przeszłości nie gwarantują wyników w przyszłości. Ten wskaźnik jest narzędziem wspomagającym analizę, a nie systemem handlowym. Zawsze zarządzaj ryzykiem odpowiednio. Handel wiąże się ze znacznym ryzykiem. Skonsultuj się z doradcą finansowym przed podjęciem decyzji handlowych.
Gotowy, aby opanować strukturę rynku?
MarketStructurePro przekształca złożony ruch cenowy w jasne, praktyczne sygnały. Pobierz teraz i zobacz strukturę rynku wyraźnie!
Tagi
Struktura rynku, SMC, Swing, Fraktale, Price Action, Smart Money, Trend
Podsumowanie
The indicator displays color-coded points on the chart—lime green for HH, orange for HL, deep sky blue for LH, and red for LL—helping traders interpret market trends, potential reversals, and support/resistance levels. It supports various trading scenarios such as trend following, breakout trading, reversal detection, and SMC strategies by identifying Break of Structure (BoS) and Change of Character (ChoCh).
Key settings include adjustable fractal periods to control signal sensitivity and label display options. MarketStructurePro is suitable for all experience levels and trading styles, including price action, swing, and day trading. It is a reactive tool that requires confirmation and should be used alongside other indicators for comprehensive analysis.