
E7 Volume Profile
Indicateur
1.16K téléchargements
Version 1.0, Feb 2025
Windows, Mac
4.6
Avis : 3
Description
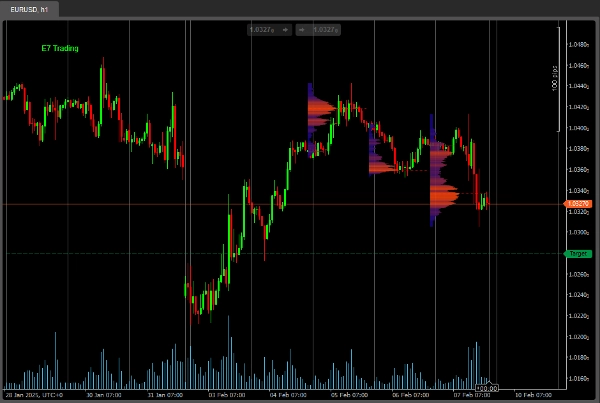
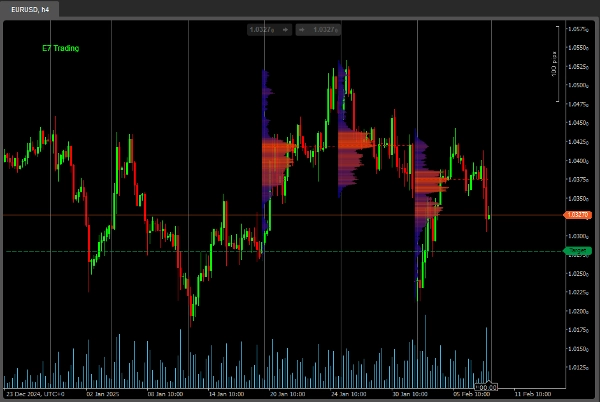
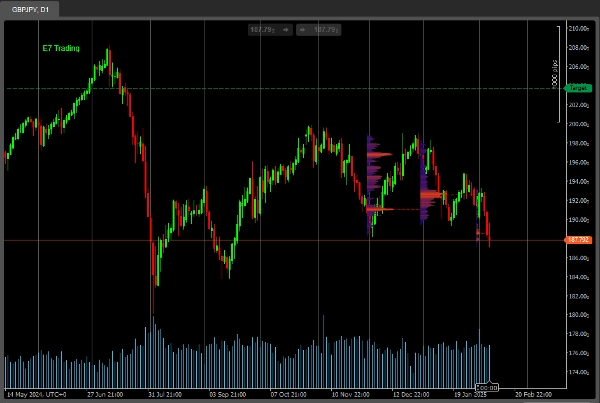
Ceci est un indicateur simple de profil de volume, personnalisé pour un look et une sensation plus modernes.
Cette version basique est limitée à seulement 3 « Périodes de retour ».
La version complète arrive bientôt, restez à l'écoute.
Bonne chasse !
Résumé
Résumé IA
E7 Volume Profile is a volume profile indicator designed with a modern visual style. It provides traders with volume distribution information over price levels, helping to identify key support and resistance areas. This basic version supports analysis over three distinct lookback periods, allowing users to observe volume patterns within limited historical ranges. The indicator is suitable for use on various timeframes, as illustrated by examples on 1-hour, 4-hour, and daily charts. A full version with expanded features is planned for future release.
Profil de l'indicateur
Avis clients
4.6
Avis : 3
5 | 67 % | |
4 | 33 % | |
3 | 0 % | |
2 | 0 % | |
1 | 0 % |
Avis clients
July 14, 2025
Pros: Clearly visualizes volume distribution with POC, VAH, VAL zones. Customizable and stable across timeframes. Cons: No tooltips or alerts. Lacks template saving and dynamic profile history. Requires confirmation tools for trading signals.
Discussion
Questions fréquentes
Les produits disponibles sur cTrader Store, notamment les bots de trading, les indicateurs et les plug-ins, sont fournis par des développeurs tiers et mis à disposition à titre informatif et à des fins d'accès technique uniquement. cTrader Store n'est pas un courtier et ne fournit aucun conseil en investissement, aucune recommandation personnelle ni aucune garantie quant aux performances futures.
Plus de cet auteur


Prix
Depuis le 18/12/2024
2
Ventes
4.26K
Installations gratuites