
Description
L'indicateur est basé sur l'analyse de l'action des prix 📈 pour identifier les changements dans la structure du marché et les zones clés d'intérêt. Voici un résumé détaillé de son fonctionnement :
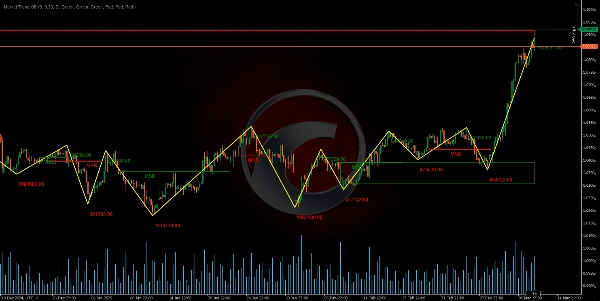
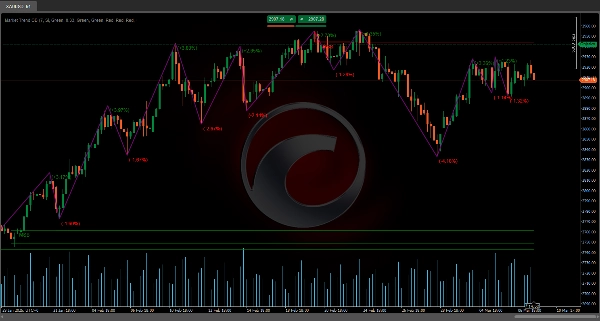
Détection des Pivots et Formation du Zigzag 🔄
Une période spécifique (définie par un paramètre de longueur) est analysée pour identifier les hauts et bas relatifs. En comparant les prix dans cet intervalle, les points pivots (points d'inflexion) sont détectés, ce qui forme, à son tour, le motif zigzag ⚡. Ce motif aide à distinguer quand une inversion de prix se produit.
Accumulation de Volume et Calcul de la Déviation 📊
Pendant le processus de détection des pivots, le volume tick est accumulé dans le segment évalué. De plus, la différence en pourcentage entre les prix des pivots est calculée pour déterminer si le mouvement est suffisamment significatif. Cette déviation est comparée à un seuil défini, ce qui aide à confirmer que le changement de structure est réel ✅.
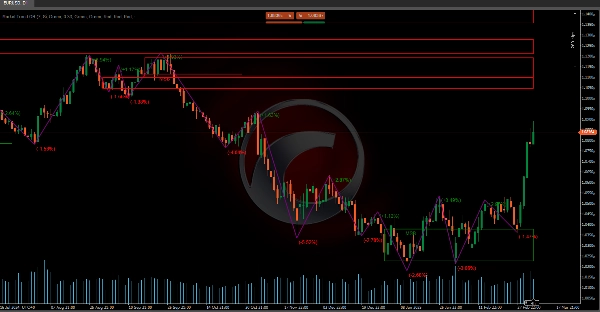
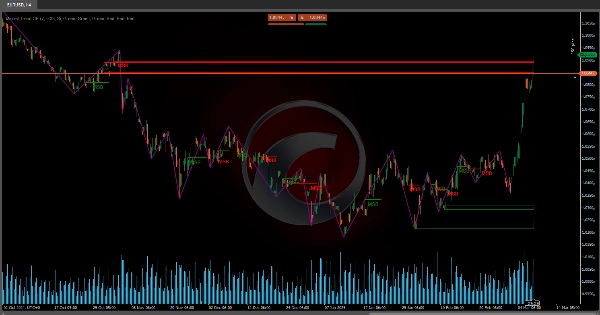
Définition de la Rupture de Structure du Marché (MSB) 🚨
L'indicateur évalue les deux derniers pivots (qu'ils soient hauts ou bas) et, en appliquant un facteur de retracement (inspiré des niveaux de Fibonacci), détermine si une rupture de structure a eu lieu.
- Si, après avoir franchi un ancien sommet, le prix commence à générer des creux plus bas, un passage à une structure baissière est identifié 🐻.
- De même, si après avoir franchi un ancien creux, le prix génère des sommets plus hauts, une transition vers une structure haussière est supposée 🐂.
Ce changement est interprété comme une Rupture de Structure du Marché (MSB).
Identification des Blocs d'Ordres et des Boîtes de Cassure 📦
Une fois une MSB détectée, des zones critiques sont définies en fonction de l'action des prix précédente :
- Blocs d'Ordres (OB) 🧱 : Ce sont des zones identifiées comme celles où la dernière action significative a eu lieu avant la cassure. Dans une structure baissière, la dernière bougie haussière avant le nouveau sommet est prise ; dans une structure haussière, la dernière bougie baissière avant le nouveau creux est utilisée.
- Boîtes de Cassure (BB) 📈 : Elles sont déterminées de manière similaire mais prennent en compte une plage supplémentaire pour confirmer que le prix a franchi le niveau précédent.
Ces zones aident à définir des zones où l'activité est concentrée et peuvent agir comme support ou résistance à l'avenir.
Visualisation des Données Pertinentes du Zigzag 📊
En plus de tracer la séquence des pivots, l'indicateur intègre des données supplémentaires :
- Prix de Renversement 💹 : La valeur exacte où le changement de tendance est détecté est enregistrée.
- Variation en Pourcentage du Renversement 🔄 : La variation en pourcentage entre le nouveau prix pivot et le précédent est calculée, indiquant l'ampleur du changement.
- Volume Accumulé 📉 : La somme du volume tick pendant le segment menant à la formation du pivot est affichée.
Ces données permettent d'évaluer la force et la pertinence du mouvement sans se baser sur des suppositions, car elles reposent sur des calculs concrets.
En résumé, l'outil analyse l'action des prix pour détecter quand le marché change de tendance (MSB) et définit des zones (blocs d'ordres et boîtes de cassure) qui peuvent être clés pour les décisions de trading 💼. L'intégration du motif zigzag avec l'analyse du volume et les déviations en pourcentage offre une vue complète de la structure du marché, fournissant des informations précises sur les points de renversement et la force du mouvement 💪.
Indicateurs du Ctrader Store :
Dynamic Market Structure
Analysis of Turning Points
Fibonacci Linear
Regression Multi-timeframe
Multi-Level Candle Bias
Tracker
Auto Support and
Resistance Trend Lines
Résumé
It defines Market Structure Breaks (MSB) by evaluating recent pivots with a retracement factor inspired by Fibonacci levels. A break in structure is signaled when price action shifts from higher highs to lower lows (bearish) or from lower lows to higher highs (bullish).
Upon detecting an MSB, the indicator identifies critical zones: Order Blocks (OB), representing the last significant candle before a breakout, and Breakout Boxes (BB), which confirm price level breaches with an additional range. These zones serve as potential future support or resistance areas.
The tool visualizes relevant zigzag data, including reversal prices, percentage changes, and accumulated volume, enabling assessment of movement strength and relevance based on concrete calculations. This comprehensive approach integrates zigzag patterns, volume analysis, and deviation metrics to provide precise information on reversal points and market movement strength, supporting informed trading decisions.
Avis clients
5 | 100 % | |
4 | 0 % | |
3 | 0 % | |
2 | 0 % | |
1 | 0 % |


