
TPO Profile v2.0
Indicateur
4.17K téléchargements
Version 1.1, Jan 2026
Windows, Mac
4.8
Avis : 7
Description
Dernière description -> 11/11/2025
Quoi de neuf dans la Révision 1 ?
- Réécrit en utilisant les améliorations liées à Order Flow Aggregated/Volume Profile.
- Mise à jour TPO en direct simultanée
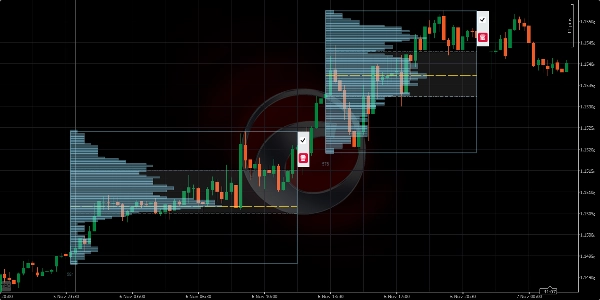
- Afficher un ou tous les (Mini-VPs/Quotidien/Hebdomadaire/Mensuel) profils en une seule fois !
- Profils de plage fixes
- Correction => Panneau des paramètres sur MacOS
================================
Préférez toujours la version du Store cTrader, elle est mise à jour en premier.
Tous les indicateurs que j'ai développés sont open source. Si vous n'avez pas accès au code, consultez le dépôt Github
Résumé
Résumé IA
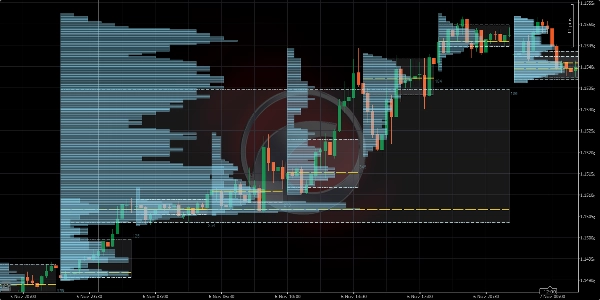
TPO Profile v2.0 is an open-source trading indicator designed for use on the cTrader platform. It provides Time Price Opportunity (TPO) profiles that display market activity divided into columns, similar to traditional market profile charts. The indicator supports multiple preset settings optimized for various asset classes including currencies, metals, and indices, with timeframes ranging from 1 minute up to 3 days.
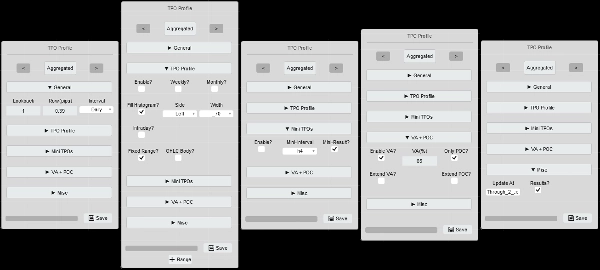
Key features include a parameters panel for quick switching between TPO modes, row height, and interval settings, enhancing user customization and ease of use. The indicator offers concurrent live TPO updates and the ability to display multiple profile types simultaneously, such as Mini Volume Profiles, Daily, Weekly, and Monthly profiles. Fixed range profiles are also supported.
TPO Profile v2.0 is designed for low resource usage, capable of running efficiently even on low-powered hardware. It requires .NET 6.0 or higher and is compatible with Mac OS. Users can synchronize the indicator’s session display with cTrader’s timezone settings for accurate period separation.
The indicator is part of a suite of volume and order flow tools available for cTrader and is maintained with ongoing updates and improvements. The source code is accessible via a public GitHub repository.
Profil de l'indicateur
Avis clients
4.8
Avis : 7
5 | 86 % | |
4 | 14 % | |
3 | 0 % | |
2 | 0 % | |
1 | 0 % |
Avis clients
April 17, 2026
December 19, 2025
November 13, 2025
September 21, 2025
July 9, 2025
Pros: Accurate TPO profile visualization, flexible period and color settings, clear POC/VAH/VAL levels. Cons: No historical profile archive, lacks alerts on key levels, slight lag on lower timeframes with dense data.
June 23, 2025
June 17, 2025
Discussion
Questions fréquentes
Forex
Indices
VWAP
Les produits disponibles sur cTrader Store, notamment les bots de trading, les indicateurs et les plug-ins, sont fournis par des développeurs tiers et mis à disposition à titre informatif et à des fins d'accès technique uniquement. cTrader Store n'est pas un courtier et ne fournit aucun conseil en investissement, aucune recommandation personnelle ni aucune garantie quant aux performances futures.


Prix
Depuis le 12/12/2024
1
Ventes
33.26K
Installations gratuites