
Order Flow Ticks v2.0
Indicador
12.13K descargas
Versión 1.1, Jan 2026
Windows, Mac
4.4
Valoraciones: 23
Descripción
Última descripción -> 11/11/2025
Cada aspecto de Order Flow Ticks (versión agregada) fue cuidadosamente diseñado pensando en el rendimiento , para que pueda funcionar incluso en máquinas de gama baja.
Aún así, aquí algunos "Consejos y Trucos" para un mejor uso:
- Los datos de ticks se almacenan en RAM, aunque cTrader ya tiene una buena gestión de memoria:
-
- Carga solo lo que realmente se necesita para el trading en vivo.
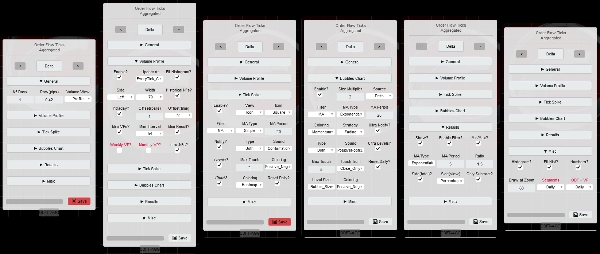
- Panel de Parámetros ya muestra qué parámetros son compatibles con cada modo.
- Intervalo de Segmentos puede cambiar el análisis de filtros, usa el intervalo Diario para el momentum intradía.
- En Marcos Temporales Superiores (incluidos gráficos basados en precio)
-
- Configura ODF + VP a Semanal
- ¿Nº días / Reiniciar Diario? ahora es Semana/Semanal.
- Todos los filtros se reiniciarán cada semana en lugar de cada día.
- "Marco Temporal Inferior" con "Tamaño de Fila Pequeño":
-
- MAs Personalizadas están hechas para acelerar el recálculo cuando se cambian configuraciones en el Panel de Parámetros.
- Si quieres usar las Medias Móviles de cTrader, configura [ODF] ¿Usar MAs Personalizadas? a Falso
-
- Ten paciencia si algún filtro [Resultados / Pico / Burbujas] está activado.
- Si se necesita Alto Rendimiento:
-
- Desactiva el Perfil de Volumen y/o usa Mini-VPs en su lugar. (por defecto)
- Usa "Concurrente" en "[VP] Estrategia de Actualización" en "Configuraciones Específicas", aunque tiene un costo en uso de RAM. (por defecto)
- Usa "Redibujar_Más rápido" en configuraciones de "Dibujo de Rendimiento" (por defecto)
- Usa MAs Personalizadas (por defecto)
- Cualquier dibujo relleno y/o de texto es bastante pesado cuando hay muchos.
- Al hacer back-testing, algunos dibujos en gráficos basados en precio están rotos, pero funcionan bien en tiempo real.
- Configuraciones Guardadas se almacenan en "Documents/cAlgo/LocalStorage/ODFT-AGG ..."
Nuevas funciones de análisis de Order Flow Ticks:
- Filtro de Picos de Ticks
-
- Media Móvil o Desviación Estándar.
- como Icono o Burbujas.
- Niveles de Pico.
- Gráfico de Picos (Burbujas):
-
- Coloreado de mapa de calor.
- Coloreado Positivo/Negativo.
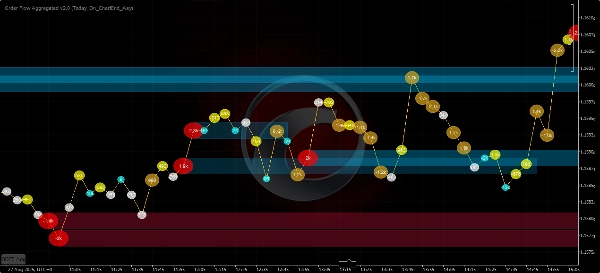
- Gráfico de Burbujas
-
- Medias Móviles, Desviación Estándar, o ambas.
- [Delta de Volumen / Cambio Delta Acumulado / Delta Restado] como fuente.
- Niveles Ultra Burbujas.
- Coloreado de mapa de calor.
- Coloreado de momentum:
-
- Desvanecimiento
- Positivo/Negativo
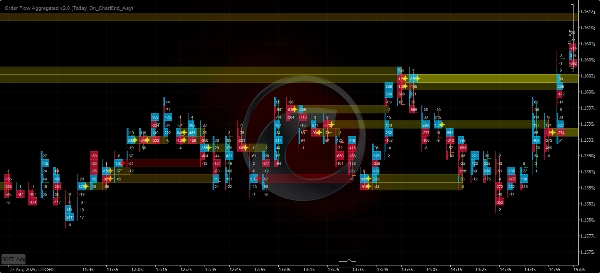
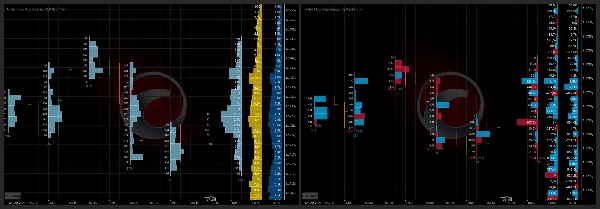
- Perfil de Volumen
-
- Mini-VPs - De 5 minutos a 1 día.
- ¡Perfiles Diarios, Semanales, Mensuales!
- Perfiles de rango fijo.
=============================
Prefiere siempre la versión de la tienda de cTrader, se actualiza primero.
Todos los indicadores que he desarrollado son de código abierto. Si no tienes acceso al código, consulta el repositorio de Github
Resumen
Resumen de IA
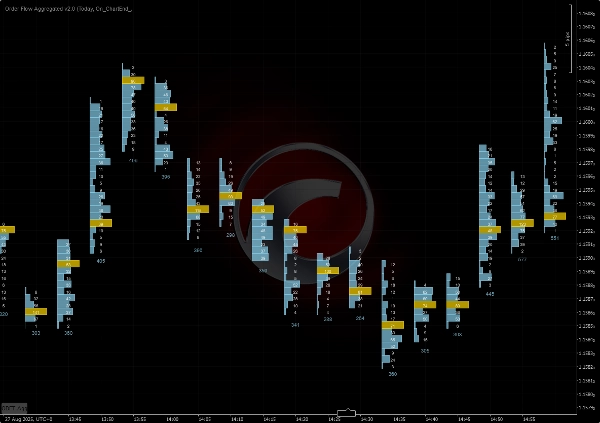
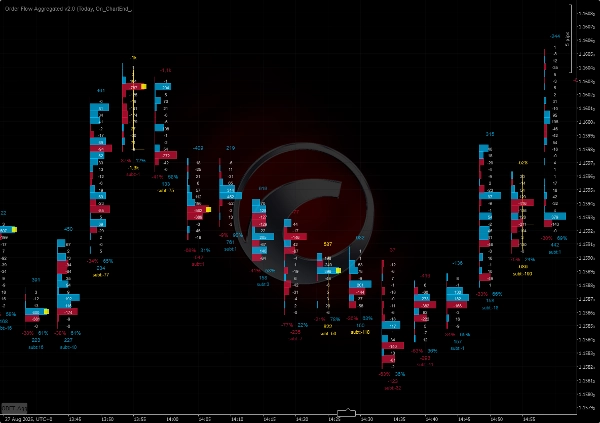
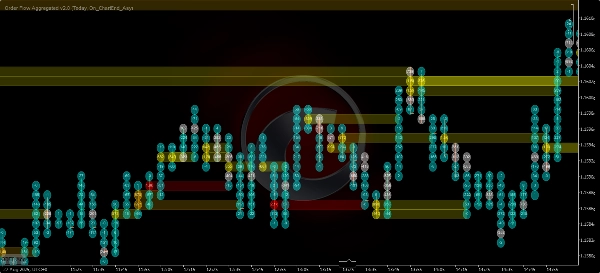
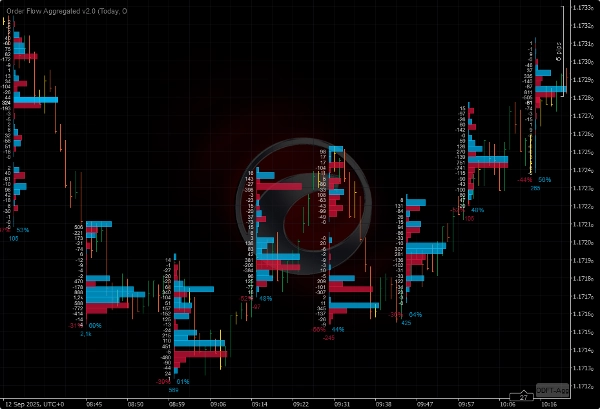
Order Flow Ticks v2.0 is an open-source indicator for the cTrader platform that adapts traditional Order Flow (Footprint) concepts to tick volume data. It supports multiple chart types including ticks, Renko, and range charts. The indicator offers several visualization modes: Normal Mode (volume profile per bar), Buy vs Sell Divided Mode (bid/ask footprint), Buy vs Sell Profile Mode, Delta Divided Mode (delta footprint), and Delta Profile Mode.
Version 2.0 introduces a parameters panel for quick switching between settings such as volume modes and row height, and it uses the Colors API exclusively. It is compatible with Mac OS and requires .NET 6.0 or higher.
Key features include:
- Tick Spike Filter with moving average or standard deviation, displayed as icons or bubbles with heatmap and positive/negative coloring.
- Bubbles Chart showing volume delta, cumulative delta change, or subtract delta with momentum coloring and ultra bubble levels.
- Volume Profile options including mini-profiles from 5 minutes to 1 day, daily, weekly, monthly, and fixed range profiles.
The indicator is optimized for performance to run efficiently on lower-end machines. It stores tick data in RAM and offers settings to balance performance and detail, including custom moving averages and concurrent update strategies. Saved settings are stored locally.
Perfil del indicador
Valoraciones de clientes
4.4
Valoraciones: 23
5 | 74 % | |
4 | 13 % | |
3 | 4 % | |
2 | 0 % | |
1 | 9 % |
Valoraciones de clientes
May 13, 2026
Just a note to say thank you to the creator for making this free of charge. Appreciate it.
March 23, 2026
It's great, Thank you! Can you pls make an update, it doesnt work fully on Indices on CFD
March 9, 2026
"Thank you very much for your work on Order Flow Tick 2.0. It is truly excellent and unique."
October 22, 2025
this is great, i just can't see all the options because the panel is cut short. i don't have access to the bubbles and other features that are apparently there in the code
September 27, 2025
August 3, 2025
Amazing indicator! Once you learn how to use it it really helps out so much, love it!
July 9, 2025
Pros: Real-time tick flow visualization with buy/sell separation. Helps assess market activity and hidden liquidity. Easy to set up, works stable on major assets. Cons: No alerts on tick spikes. No history or tooltips. Requires experience to interpret data correctly.
July 3, 2025
June 20, 2025
Great indicator. It takes a bit of work to learn how to use it properly. Not to be used in isolation, you need to plan potential reversal zones.
April 15, 2025
This looks promising! I tested it out manually, but I would love to automate it! How could we get the source code? :) Really, Pls.
Conversación
Preguntas frecuentes
VWAP
Los productos disponibles a través de cTrader Store, incluidos bots, indicadores y plugins para operar, son proporcionados por desarrolladores de terceros y están disponibles únicamente con fines informativos y de acceso técnico. cTrader Store no es un bróker, por lo que no proporciona asesoramiento de inversión, recomendaciones personales ni ninguna garantía de rentabilidad futura.


Precio
Desde 12/12/2024
1
Ventas
33.36K
Instalaciones gratis