TRWatermark_v1.0
インジケーター
216 ダウンロード数
バージョン 1.0、Nov 2025
Windows、Mac
4.5
レビュー: 2
説明
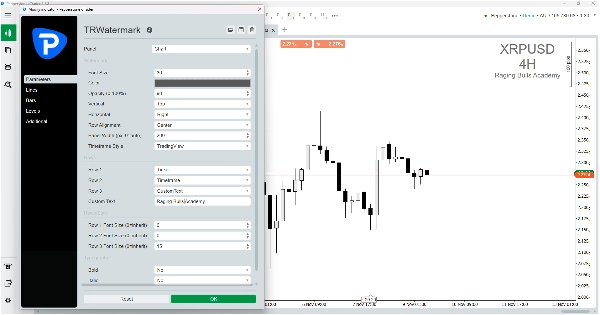
TR Watermark(右上ウォーターマーク)は、cTrader用のカスタマイズ可能なチャートウォーターマークです。シンボル、時間枠、ブローカーまたは取引所、ローソク足のカウントダウンタイマーやカスタムテキストなどの重要なチャート情報を、価格ローソク足や描画を覆うことなく表示します。
このインジケーターは、ウォーターマークをチャートの任意の角に配置できるため、さまざまなレイアウトの好みに対応できます。
特徴:
- 3つの設定可能な行。各行は時間枠、シンボル、ブローカー、カスタムテキスト、カウントダウン、または空欄に設定可能。
- TradingViewおよびMetaTraderの時間枠フォーマットの両方に対応。
- 位置調整可能:上、中、下および左、中央、右。
- 行ごとのフォントサイズとグローバルフォントオプション。
- 現在のローソク足の残り時間を表示するカウントダウンタイマー。
- 不透明度と配置設定の調整可能。
使い方:
1. インジケーターをcTrader Automateワークスペースに追加します。
2. 「ビルド」をクリックし、TR Watermarkを任意のチャートに適用します。
3. 必要に応じて行とスタイルを設定します。
4. 必要に応じてインジケーターを.algoファイルとしてエクスポートします。
名前について:
TR WatermarkはTop Right Watermarkの略です。トレーダーがチャートの中央ではなく隅のエリアで重要なチャート情報を確認できるように開発され、チャートデータの分析を妨げないようにしています。
概要
AIによる概要
TR Watermark (Top Right Watermark) is a customizable indicator for the cTrader platform designed to display key chart information unobtrusively in any corner of the chart. It shows details such as the trading symbol, timeframe, broker or exchange name, a live candle countdown timer, or custom text without overlapping price candles or drawings. The indicator features three configurable rows, each capable of displaying different information or remaining empty, supporting both TradingView and MetaTrader timeframe formats. Users can adjust the watermark’s position (top, middle, bottom; left, center, right), font sizes per row and globally, opacity, and alignment settings. Installation involves adding the indicator to the cTrader Automate workspace, building, and attaching it to a chart, followed by configuration of display rows and styles. The watermark helps traders keep essential chart data visible while maintaining a clear view of price action and technical analysis. It supports multiple markets including Forex, stocks, indices, commodities, and cryptocurrencies.
インジケーターのプロフィール
カスタマーレビュー
4.5
レビュー: 2
5 | 50 % | |
4 | 50 % | |
3 | 0 % | |
2 | 0 % | |
1 | 0 % |
カスタマーレビュー
January 20, 2026
A very useful tool to always know which instrument you’re viewing on the chart, especially since cTrader doesn’t offer a native solution for this. The ability to freely move the watermark around the screen is a great touch, as it prevents it from overlapping with the chart candles. Highly recommended.
November 24, 2025
TRWatermark_v1.0 is a clean and lightweight tool that adds customizable watermarks to your charts. Great for reports, streams, and organized multi-chart setups. Fast, stable, and easy to tweak. Could benefit from extra presets and more watermark styles, but it already does its job perfectly.
ディスカッション
よくあるご質問
BTCUSD
Prop
Forex
Indices
Commodities
Crypto
Stocks
XAUUSD
NAS100
cTrader Storeで入手可能な取引ボット、インジケーター、プラグインなどの商品は、第三者の開発者が提供するものであり、情報と技術の取得のみを目的としてご利用いただけます。cTrader Storeはブローカーではなく、投資助言や個人的な推奨を行うことも、将来のパフォーマンスを保証することもありません。
これも好きかも


価格
登録日 03/11/2025
10.24M
取引数量
59.18K
獲得pips
216
無料インストール