

Descrizione
1️⃣ Cosa fa questo indicatore?
Questo strumento riassume la direzione delle candele su più timeframe in un unico punto sul tuo grafico.
Per ogni timeframe, controlla l’ultima candela chiusa e mostra:
StatoSignificato
🟢 Toro
Chiusura > Apertura (acquirenti al controllo)
🔴 Orso
Chiusura < Apertura (venditori al controllo)
⚪ Doji
Chiusura ≈ Apertura (indecisione)
Timeframe mostrati:
- Giornaliero
- H4
- H1
- M30
- M15
- M5
Tutti gli stati sono mostrati direttamente sul grafico, quindi non è necessario cambiare timeframe.
2️⃣ Perché questo strumento è potente
🔥 Risolve un problema comune ai trader
La maggior parte dei trader si chiede:
“Sto facendo trading con o contro il trend del timeframe superiore?”
Questo indicatore risponde istantaneamente.
Invece di indovinare:
- Vedi l’allineamento del trend
- Eviti entrate controtrend
- Migliori tempismo e fiducia
3️⃣ Come funziona l’indicatore
📌 Logica dello stato della candela
- Usa l’ultima candela chiusa (
Last(1)) - Nessun repainting
- Conferma affidabile
📌 Dati multi-timeframe
- Recupera dati reali delle candele da ogni timeframe
- Indipendente dal timeframe del grafico su cui ti trovi
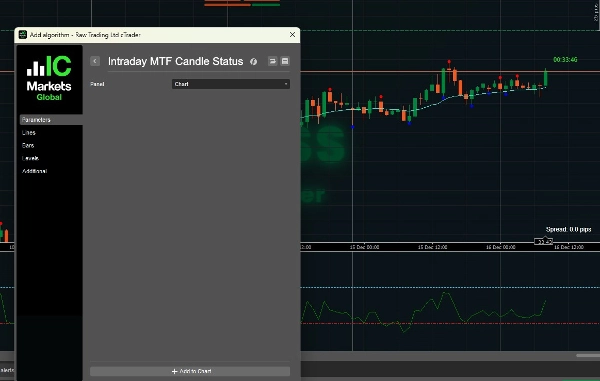
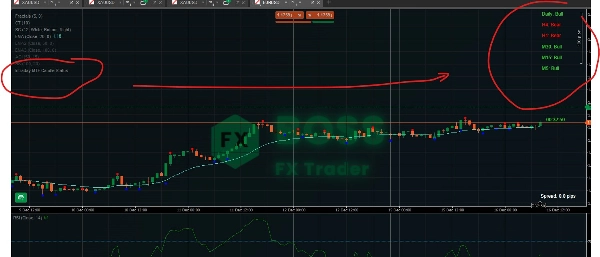
📌 Visualizzazione sul grafico
- Disegna etichette di testo nell’angolo in alto a destra
- Codificato a colori per una lettura immediata
- Aggiornato ad ogni tick
4️⃣ Come usarlo efficacemente (scenari di trading)
🟢 Scenario 1: Conferma del trend (caso d’uso migliore)
✔ Regola:
Fai trading solo quando i timeframe superiori e inferiori sono d’accordo
Esempio:
Giornaliero: Toro
H4: Toro
H1: Toro
M15: Toro
M5: Toro
✅ Ambiente di acquisto ad alta probabilità
Usa:
- Ritracciamenti
- Rotture
- Entrate di continuazione
❌ Evita le VENDITE qui
🔴 Scenario 2: Avviso controtrend
Giornaliero: Toro
H4: Toro
H1: Orso
M15: Orso
M5: Orso
⚠️ Il mercato è in ritracciamento, non in inversione.
Azioni migliori:
- Aspetta che M5/M15 torni Toro
- Evita di inseguire le VENDITE
- Cerca setup di acquisto al supporto
⚪ Scenario 3: Mercato instabile / laterale
Giornaliero: Toro
H4: Doji
H1: Doji
M15: Orso
M5: Toro
🚫 Condizioni di bassa qualità
Raccomandato:
- Riduci la dimensione della posizione
- Evita operazioni di breakout
- Aspetta chiarezza nella struttura
5️⃣ Esempio di strategia scalping (entrate M5)
🔹 Setup di acquisto ideale
- Giornaliero → Toro
- H4 → Toro
- H1 → Toro
- M15 → Toro
- M5 → Orso → diventa Toro
📍 Entrata:
- Quando M5 torna a essere Toro
- Combina con:
-
- Supporto
- Frattali
- EMA / VWAP
🔹 Setup di vendita ideale
Logica opposta:
- TF superiori → Orso
- Entra al completamento del ritracciamento su M5
6️⃣ Migliori combinazioni di timeframe
Stile di tradingTimeframe di focus
Scalping
H1 → M15 → M5
Intraday
H4 → H1 → M15
Swing
Giornaliero → H4 → H1
7️⃣ Cosa questo strumento NON è
🚫 Non è un segnale di entrata da solo
🚫 Non è un indicatore di inversione
🚫 Non sostituisce la struttura / price action
✅ È uno strumento di bias e conferma
8️⃣ Migliori indicatori da combinare
Abbinamenti altamente raccomandati:
- ✅ Frattali (li usi già)
- ✅ Struttura di mercato (HH / LL)
- ✅ Supporto e resistenza
- ✅ EMA 50 / EMA 200
- ✅ VWAP
9️⃣ Regole di trading professionali usando questo strumento
✔ Fai trading solo nella direzione del HTF
✔ Usa il LTF solo per il tempismo dell’entrata
✔ Ignora i segnali quando Giornaliero e H4 non sono d’accordo
✔ Non fare overtrading durante segnali contrastanti
✔ Lascia che la struttura confermi il bias della candela
🔟 Riepilogo finale
IntradyMultiTimeframeCandleStatus = Cruscotto del bias di mercato
Ti offre:
- Chiarezza immediata del trend
- Operazioni a probabilità più alta
- Decisioni meno emotive
- Esecuzione più pulita
Dai un’occhiata al nostro prodotto.
Riepilogo
Recensioni dei clienti
5 | 100 % | |
4 | 0 % | |
3 | 0 % | |
2 | 0 % | |
1 | 0 % |


