説明
Pinescriptlabs ストアのインジケーター: 🤖Pinescriptlabs ストア cBots :
ICT Power of 3 (cBot) Gold & BTC BreakoutSession Pivots(new)YieldShield"
SmartTrend Support &
Resistance Lines
Dynamic Market Structure
Analysis of Turning Points
Fibonacci Linear
Regression Multi-timeframe
Multi-Level Candle Bias
Tracker
Auto Support and
Resistance Trend Lines
All Support and
Resistance Levels
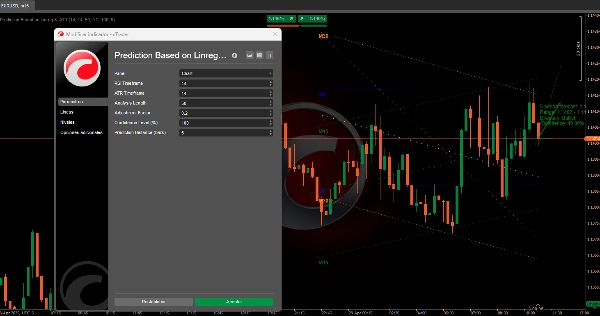
📈 マルチタイムフレーム回帰チャネル&ATR予測アルゴリズム
このシステムは、資産の潜在的な価格変動を予測します。 マルチタイムフレームのトレンド分析 📊、市場のボラティリティ 📉、およびテクニカル指標の確認 ✅を組み合わせています。目標は、 将来の価格レンジを測定可能な信頼度で予測し、 高確率のリスク・リワード機会 💰を特定するのに理想的です。
🔧 ステップバイステップの仕組み
1️⃣ マルチタイムフレームトレンド分析
- タイムフレームを横断する回帰チャネル:
アルゴリズムは同時に 4つの異なるタイムフレーム(短期から長期まで)を分析します。各タイムフレームについて: -
- 過去の価格動向に基づく 統計的トレンドラインを計算します。
- このラインの周囲に 予測チャネルを定義します(過去のボラティリティを使って上下の境界を設定)。
- 階層的影響:
短いタイムフレームは最終的な方向性に より大きな重みを持ち、最近の動きに対する感度を反映します。
2️⃣ ボラティリティ統合(ATR)🌊
- 動的ボラティリティ調整:
予測は現在の市場状況に適応します: -
- 高ボラティリティ → より広い予測範囲
- 低ボラティリティ → 保守的な調整
- 将来のレンジスケーリング:
予測バンドは 期待されるボラティリティに基づいて自動的に調整されます。
3️⃣ トレンド確認システム ✅
回帰ベースの方向性を検証または疑問視するために、 4つの主要なシグナルを組み合わせます:
- 移動平均のクロス(トレンド確認)
- モメンタムオシレーター(強さの評価)
- ボラティリティ指標(買われ過ぎ/売られ過ぎの検出)
- ダイバージェンス分析(トレンド反転の手がかり)
- 出力: スコアリングシステムで予測されたトレンドを強化または疑問視します。
4️⃣ 信頼度計算 🎯
- タイムフレームの整合性:
トレンドが タイムフレーム間で一致すると信頼度が高まります。 - ユーザー定義の閾値:
トレーダーは 最低信頼度レベルを設定して、高確度のシグナルのみをフィルタリングできます。
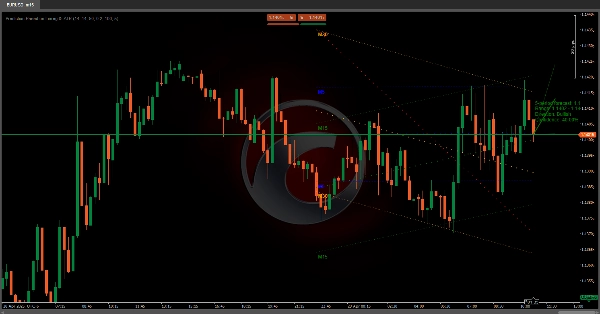
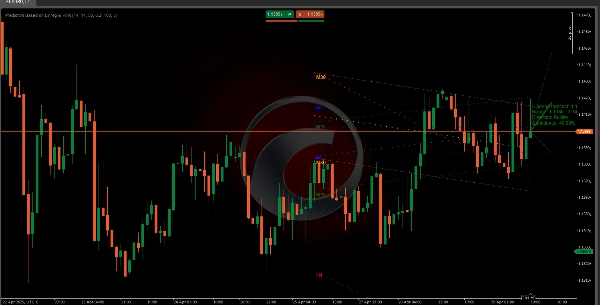
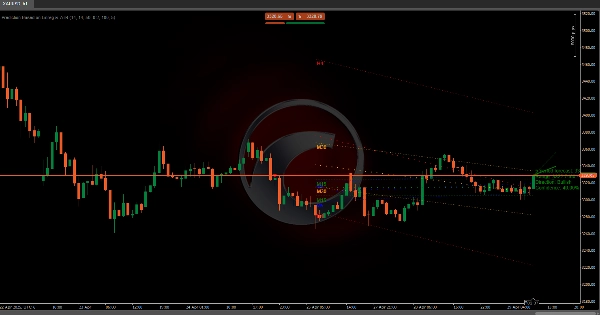
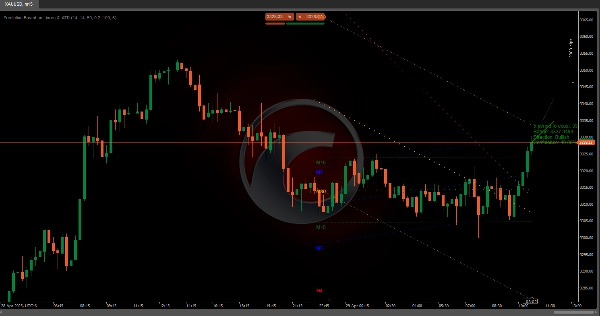
5️⃣ 直感的なビジュアライゼーション 📉📈
- 予測ライン:
中央の期待される経路を示します (緑 = 強気 🟢、赤 = 弱気 🔴、灰色 = 中立 ⚪)。 - レンジバンド:
ボラティリティに合わせて調整された 最も可能性の高い価格変動ゾーンを強調表示します。 - 情報ラベル:
予測価格、レンジ、方向性、信頼度レベルを 要約します。
🌟 主な利点
- 多次元アプローチ: トレンド、ボラティリティ、モメンタムを組み合わせて 誤信号を減らします。
- 自己調整: 変動の激しい市場やトレンド市場に 自動的に適応します。
- 透明な指標: 定量的な信頼度により期待値を管理しやすくします。
📌 実用例
システムが以下を検出した場合:
- 短期タイムフレームでの強気トレンド+モメンタムの確認
- 最近のボラティリティが低い
- 強いタイムフレームの一致
→ 狭いバンドと高い信頼度(例:85%)で価格上昇を予測します 🚀
概要
The ATR component dynamically adjusts the prediction bands to current market conditions, widening during high volatility and narrowing during low volatility periods. A trend confirmation system integrates four key signals—moving average crosses, momentum oscillators, volatility indicators, and divergence analysis—to validate or question the regression-based trend, producing a scoring system that indicates trend strength.
Confidence levels are calculated based on alignment of trends across timeframes, with user-configurable thresholds to filter signals by certainty. Visualization includes a central prediction line (color-coded for bullish, bearish, or neutral trends), range bands highlighting probable price zones, and an info label summarizing projected price, range, direction, and confidence.
The indicator supports markets including cryptocurrencies (e.g., BTCUSD), commodities (e.g., XAUUSD), and others. It aims to identify high-probability risk-reward opportunities by combining trend, volatility, and momentum analysis in a self-adjusting, transparent framework.