
Descrição
O indicador TECHNICAL ANALYSIS é uma solução avançada de análise técnica desenvolvida para a plataforma cAlgo, integrando múltiplos indicadores técnicos focados em identificar tendências robustas, momentum de mercado e confirmação de volume. Ele combina o ADX (Índice Direcional Médio) com análise de inclinação, filtragem de volume e análise técnica multi-indicadores em tempo real, oferecendo aos traders uma visão abrangente e confiável para a tomada de decisões.
🔍 Estratégia Principal
1. Base: ADX + DI (Sistema de Movimento Direcional)
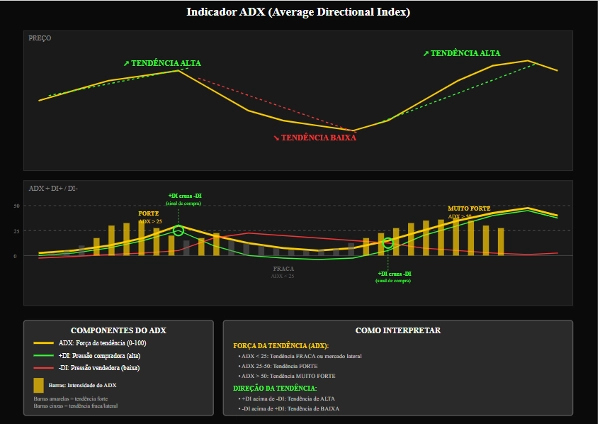
O núcleo do indicador é o ADX (Índice Direcional Médio), que mede a força da tendência.
Os componentes +DI (Indicador Direcional Positivo) e -DI (Indicador Direcional Negativo) identificam a direção da tendência:
+DI > -DI → Tendência de alta
-DI > +DI → Tendência de baixa
2. Análise Dinâmica de Momentum com Inclinação
A inclinação do ADX, +DI e -DI é calculada usando regressão linear.
Isso permite identificar se a tendência está:
Ganhando força (inclinação positiva)
Perdendo força (inclinação negativa)
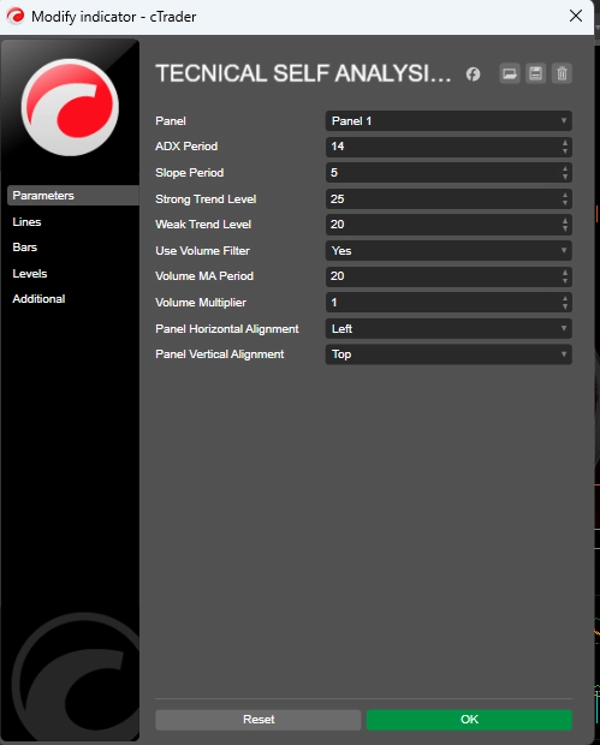
3. Níveis de Referência
Nível de Tendência Forte: Nível acima do qual a tendência é considerada forte (padrão: 25)
Nível de Tendência Fraca: Nível mínimo para considerar uma tendência válida (padrão: 20)
Tendências abaixo do nível fraco são tratadas como laterais ou sem direção clara.
📈 Geração de Sinais
Condições de Compra
✅ +DI cruzando acima de -DI
✅ ADX acima do nível de tendência fraca (Nível de Tendência Fraca)
✅ Inclinações positivas do ADX e +DI
✅ Confirmação de volume (opcional)
Condições de Venda
✅ -DI cruzando acima de +DI
✅ ADX acima do nível de tendência fraca (Nível de Tendência Fraca)
✅ Inclinações positivas do ADX e -DI
✅ Confirmação de volume (opcional)
Sinais Fortes: Quando o ADX está acima do Nível de Tendência Forte e as inclinações são significativamente positivas, o indicador gera sinais reforçados, evitando entradas consecutivas repetidas. 📊 Filtro de Volume (Opcional)
O indicador pode exigir confirmação de volume antes de gerar sinais.
O volume atual deve ser maior ou igual à média móvel do volume × multiplicador.
Isso ajuda a filtrar falsos rompimentos e sinais em mercados ilíquidos.
🧠 Análise Técnica Avançada (Painel Interativo)
TECHNICAL ANALYSIS inclui dois painéis interativos no gráfico:
1. INFORMAÇÕES DE TENDÊNCIA
Tipo de Tendência: Tendência de alta / Tendência de baixa / Lateral
Força da Tendência: Forte / Fraca
Momentum: Fortalecendo / Enfraquecendo / Estável
Valores atuais de ADX, +DI, -DI e Inclinação
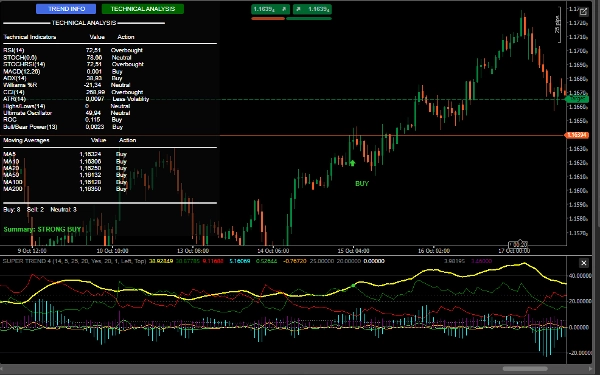
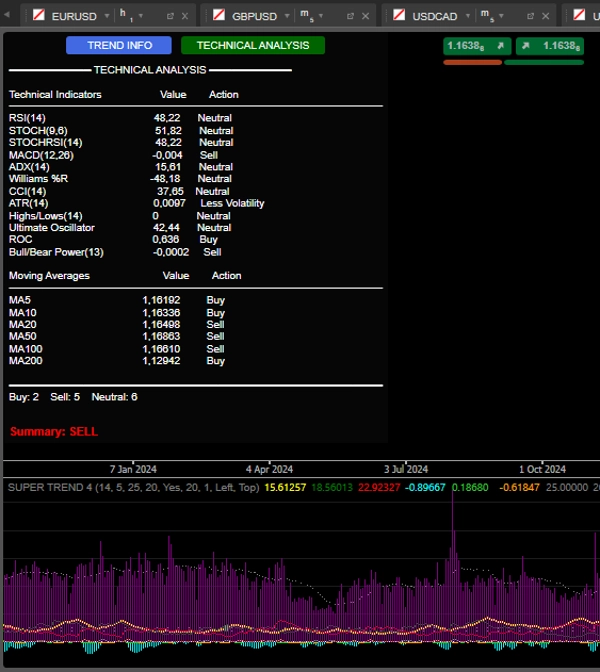
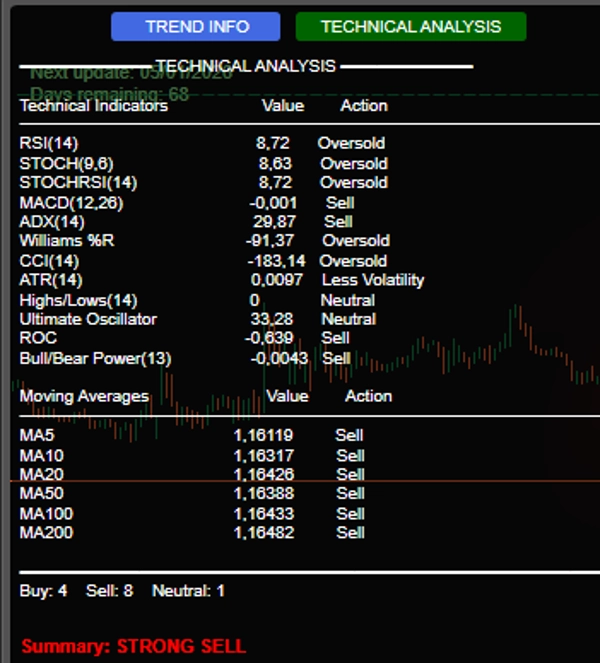
2. ANÁLISE TÉCNICA
Realiza uma análise multi-indicadores em tempo real, incluindo:
RSI(14) – Sobrecomprado/Sobrevendido
Estocástico(14) – Momentum
MACD(12,26) – Cruzamentos e divergências
Williams %R – Extremos de mercado
CCI(14) – Desvios do preço típico
ROC(12) – Taxa de variação
Oscilador Ultimate – Confirmação de força
Bull/Bear Power – Pressão de compra/venda
Médias Móveis (5,10,20,50,100,200) – Tendência de longo prazo
Resumo Final: O sistema conta os sinais de compra/venda/neutro e emite uma recomendação clara:
COMPRA FORTE (≥7 sinais de compra)
COMPRA
VENDA
VENDA FORTE (≥7 sinais de venda)
NEUTRO
🔔 Alertas e Visualização
Sinais visuais no gráfico:
Setas verdes/vermelhas com etiquetas "BUY"/"SELL"
Notificações sonoras (Windows)
Logs detalhados no console com:
Hora do sinal
Valores de ADX, DI e volume (se habilitado)
🛡️ Vantagens Competitivas
✅ Integração de múltiplos indicadores em um único painel
✅ Foco na força e direção da tendência (não apenas preço)
✅ Filtro de volume para maior confiabilidade
✅ Interface interativa e informativa
✅ Sinais claros com alertas visuais e sonoros
Esta é uma versão de teste.


