Descrição
O indicador CRT (Candle Range Theory) é uma ferramenta analítica poderosa projetada especificamente para traders que seguem a metodologia ICT (Inner Circle Trader). Este indicador identifica padrões essenciais de velas ligados ao CRT, que são cruciais para entender os movimentos do mercado e a ação do preço.
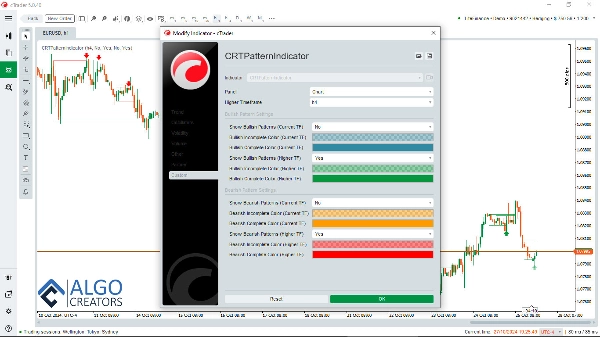
O indicador CRT para cTrader vem equipado com capacidades multi-temporais, permitindo que os traders visualizem padrões CRT de timeframes superiores (HTF) enquanto operam em timeframes inferiores (LTF). Essa funcionalidade é vital para obter insights sobre a estrutura geral do mercado e melhorar as decisões de negociação.
Movimento de preço e ICT Power of 3 (AMD):
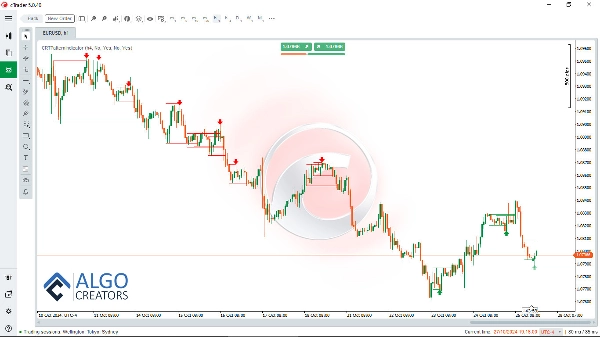
O indicador CRT simplifica a análise dos movimentos de preço e o reconhecimento de padrões associados ao Power of 3 do ICT (Anatomy of Market Dynamics - AMD).
CRT LTF dentro de um CRT HTF:
Ao identificar facilmente os pontos-chave de suporte e resistência, os traders podem analisar a ação do preço com muito mais clareza. Além disso, o indicador CRT destaca padrões HTF e LTF, ajudando os traders a navegar nas dinâmicas de vários ciclos de mercado.
usar o indicador CRT com outros conceitos de negociação:
Combinar o CRT com outros conceitos de negociação como FVGs, blocos de ordens e turtle soup aumenta a probabilidade de identificar negociações bem-sucedidas.
Além disso, o indicador CRT serve como um complemento inestimável para o Smart Money Assistant , um instrumento avançado projetado para ajudar traders de smart money com insights críticos do mercado e tomada de decisões. Combinados, esses dois indicadores criam uma caixa de ferramentas de negociação holística que aprimora a capacidade do trader de analisar e agir.
Download Smart Money Assistant: https://ctrader.com/algos/show/3956/
Para aumentar ainda mais as estratégias de negociação, o FVG Finder pode ser usado junto com o indicador CRT. Esta ferramenta detecta Fair Value Gaps (FVGs) no gráfico, que, quando usados em conjunto com os sinais do CRT, aumentam a probabilidade de realizar negociações bem-sucedidas.
Download do indicador FVG finder: https://ctrader.com/algos/show/3877/
Ao integrar esses indicadores, os traders podem estabelecer um sistema robusto que aproveita setups de alta probabilidade, permitindo-lhes navegar efetivamente pelos mercados e otimizar seus resultados de negociação.
Download do indicador CRT com Alertas:: www[dot]AlgoCreators[dot]net
Com o CRT, Smart Money Assistant e FVG Finder em sua caixa de ferramentas, você pode maximizar sua compreensão das tendências do mercado e melhorar seu desempenho geral em negociações, tornando-se um recurso essencial para traders que desejam se destacar no estilo de negociação ICT.
Resumo
It simplifies the recognition of price movements related to ICT’s Power of 3 (Anatomy of Market Dynamics - AMD) and highlights critical support and resistance levels. By displaying both higher and lower timeframe patterns, it helps traders interpret market cycles more clearly.
The CRT indicator can be combined with other trading concepts such as Fair Value Gaps (FVGs), order blocks, and turtle soup patterns to enhance trade identification. It also complements the Smart Money Assistant indicator, providing a comprehensive toolkit for smart money trading analysis.
Additionally, pairing the CRT indicator with the FVG Finder, which detects Fair Value Gaps, can improve the probability of successful trades. Together, these tools support the development of robust trading strategies aligned with the ICT style.
Avaliações de clientes
5 | 85 % | |
4 | 15 % | |
3 | 0 % | |
2 | 0 % | |
1 | 0 % |