Descrição
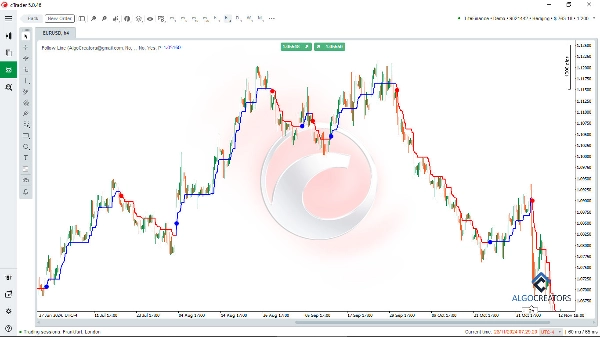
O Indicador Follow Line é um poderoso indicador cTrader para análise técnica, ajudando os traders a identificar pontos ótimos de entrada e saída nos mercados financeiros. Ao combinar as Bandas de Bollinger e o indicador ATR, ele filtra tendências e fornece sinais confiáveis de compra e venda.
Com este indicador, você pode facilmente identificar tendências de mercado ascendentes ou descendentes e seguir sinais de alta confiança.
Os traders podem combinar o Indicador Follow Line com ferramentas avançadas como o cTrader Indicador Smart Money Assistant e osciladores como o MACD para aprimorar sua análise e confirmar entradas de negociação.
Suas configurações personalizáveis e alertas em tempo real fazem dele uma adição valiosa para qualquer estratégia de negociação, permitindo que os usuários executem operações bem-sucedidas com confiança e precisão.
Principais Características:
- Detecção de Tendência: Use o Follow Line para identificar tendências de mercado de alta ou baixa.
- Sinais de Compra/Venda: Exibe sinais precisos de compra e venda baseados em rompimentos das Bandas de Bollinger.
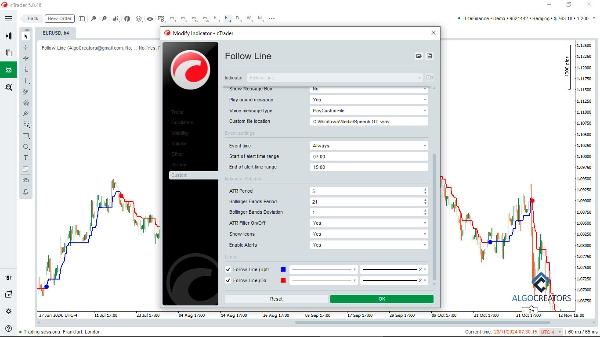
- Filtro ATR: Opção para ativar ou desativar o filtro ATR para maior precisão dos sinais.
- Configurações Personalizáveis: Ajuste o período das Bandas de Bollinger, desvio padrão e período do ATR.
- Representação Visual: Mostra sinais no gráfico usando ícones intuitivos (setas ou linhas).
- Alertas: Receba alertas instantâneos sempre que um sinal de compra ou venda aparecer.
Este indicador é altamente personalizável, permitindo que os traders ajustem os períodos das Bandas de Bollinger, desvios padrão e configurações do ATR para adequar à sua estratégia. Indicações visuais e alertas instantâneos tornam-no fácil de usar e eficaz tanto para scalping quanto para swing trading. Com recursos como detecção de tendência, gerenciamento de risco e configurações personalizáveis, o Indicador Follow Line é ideal para traders de forex, criptomoedas e ações que buscam aprimorar sua análise técnica e desempenho nas negociações.
Perfeito para identificar oportunidades precisas no mercado!
Resumo
Users can customize settings such as Bollinger Bands period, standard deviation, and ATR period to align with their trading strategies. The indicator visually represents signals on the chart using intuitive icons like arrows or lines and provides real-time alerts when signals occur. It supports various trading styles, including scalping and swing trading, and is suitable for forex, cryptocurrency, and stock markets.
The Follow Line indicator can be combined with other tools like the cTrader Smart Money Assistant and MACD oscillators to confirm trade entries and enhance analysis. Its customizable features and alert system assist traders in identifying precise market opportunities and managing risk effectively.
Avaliações de clientes
5 | 60 % | |
4 | 20 % | |
3 | 20 % | |
2 | 0 % | |
1 | 0 % |


![Logótipo de "[Stellar Strategies] Market Regime Filter"](https://cdn.ctrader.com/image/webp/3bdeba11-7e8b-4e5f-9af9-d562f48df039_28423)