
说明
用 cTrader 上最先进的中位数指标,变革您的技术分析!
VMM 平均中位数是经典中位数指标的革命性进化,专为追求精准、速度和可靠性的专业交易者设计。通过优化算法和智能趋势检测,该指标在金融市场中提供真正的竞争优势。
🎯 智能趋势检测
可配置算法(2-5根K线)适应不同交易风格
高级噪声过滤器 - 忽略十字星和无关蜡烛图
精准箭头,偏移量可自定义
增强的“智能价格”逻辑,提升信号质量
🎨 完全自定义
15+ 可调参数,适配任何策略
颜色、样式和粗细完全可定制
性能与准确性的细粒度控制
直观界面,逻辑分组清晰
📊 交易者的优势
⚡ 适合剥头皮和日内交易者:
超快响应(毫秒级)
即时反转检测
极低资源消耗
非常适合分笔图和1分钟图
📈 适合波段交易者和投资者:
更可靠的趋势分析
复杂的噪声过滤
长期稳定的性能表现
多时间框架理想选择
💻 适合 VPS/多货币对用户:
CPU 使用率降低高达80%
优化的内存占用
无延迟的同时执行
真实节省托管成本
🔧 高级技术特性
智能缓存系统:
缓存效率:正常使用下85-95%
定期自动清理
使用 ConcurrentDictionary 保证线程安全
算法优化:
优化的 O(n log n) 中位数计算
内存预分配以实现最大速度
稳健的边界检查
专业可视化:
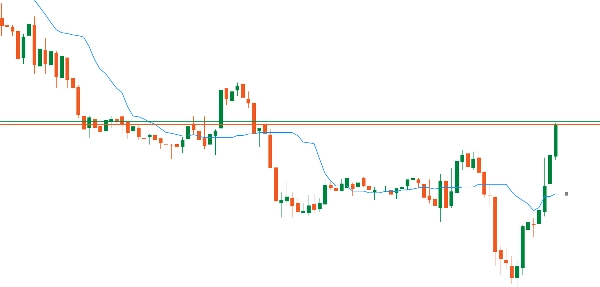
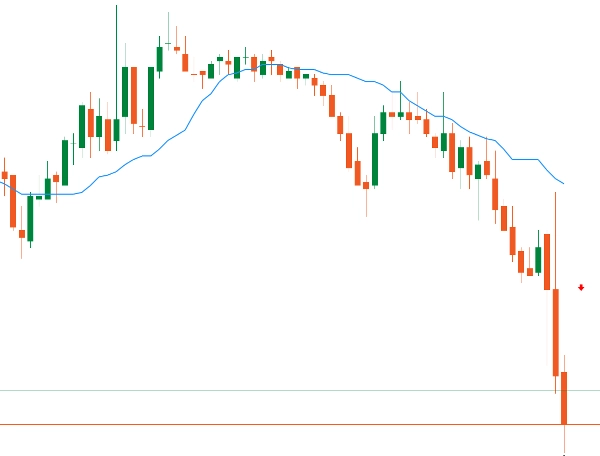
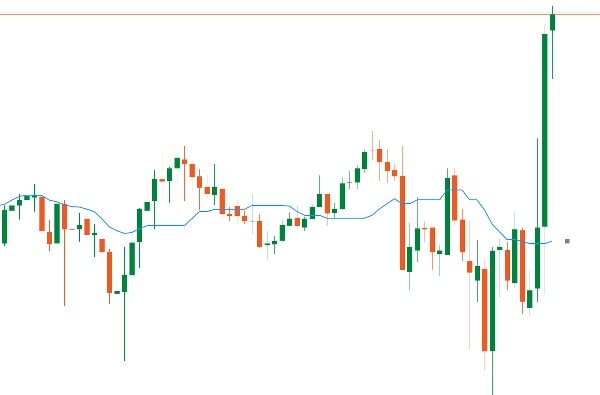
平滑连续的中位数线
带智能定位的趋势箭头
多样线条样式(实线、点线等) 牛市/熊市颜色可定制
中位数 vs 简单移动平均线:真实优势
📊 工作原理:
简单移动平均线(SMA):简单平均 - 汇总所有价格(包括异常值)
中位数(MEDIAN):排序后的中间值 - 自动忽略尖峰
🎯 快速示例:
价格:100, 101, 102, 103, 150(尖峰)
SMA:111.2 ❌(被尖峰扭曲)
中位数:102 ✅(真实市场价值)
⭐ 主要优势:
1️⃣ 自然过滤器 - 自动忽略异常值/尖峰
2️⃣ 更清晰的信号 - 减少40-60%的误报
3️⃣ 抗操纵性强 - 泵/抛对其影响较小
4️⃣ 适合波动性 - 在混乱市场中保持稳定
🔥 适合交易者:
剥头皮:过滤高频噪声
日内交易:更精准的入场时机
波段交易:识别真实趋势,而非噪声
🚀 中位数是智能的简单移动平均线 - 显示真实的价格共识!


