
설명
개요
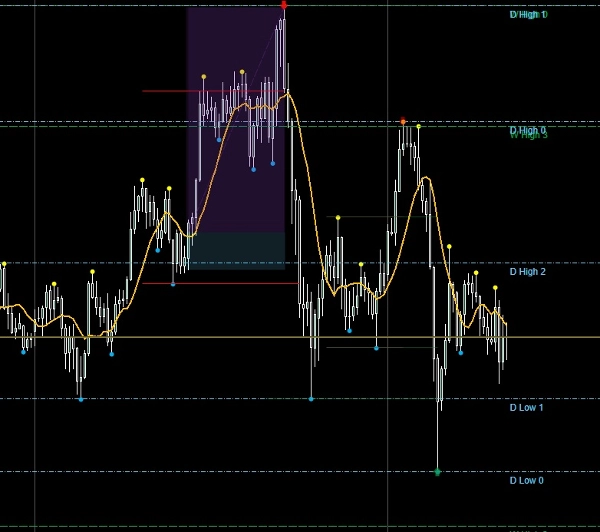
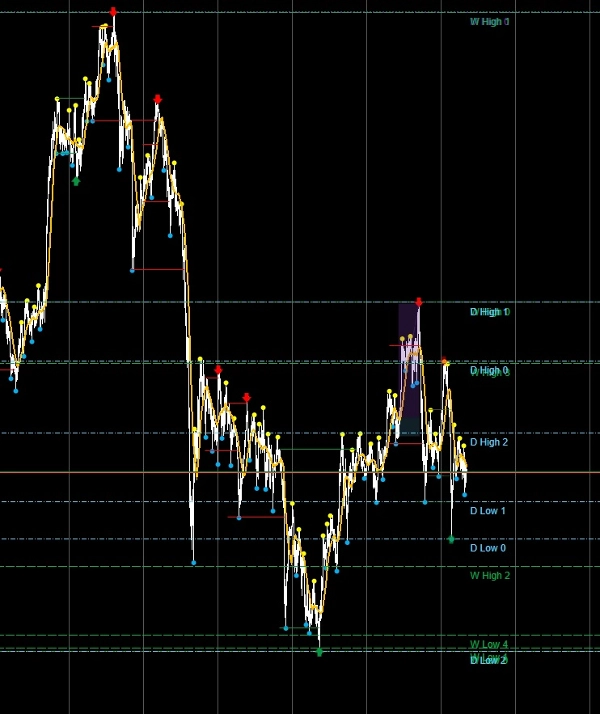
The Key Levels Indicator는 일중 실행을 안내하기 위해 상위 타임프레임 앵커에 의존하는 트레이더를 위해 제작되었습니다. 월간, 주간, 일간 고점과 저점을 자동으로 식별하고 수평선을 그려 여러 타임프레임에 걸친 즉각적인 구조적 인식을 제공합니다. 각 레벨은 완전히 사용자 정의할 수 있어, 플레이북과 작업 흐름에 맞게 시각적 요소를 조정할 수 있습니다.
주요 기능
- 🔹 다중 타임프레임 레벨 – 월간, 주간, 일간 바의 고점과 저점을 표시합니다.
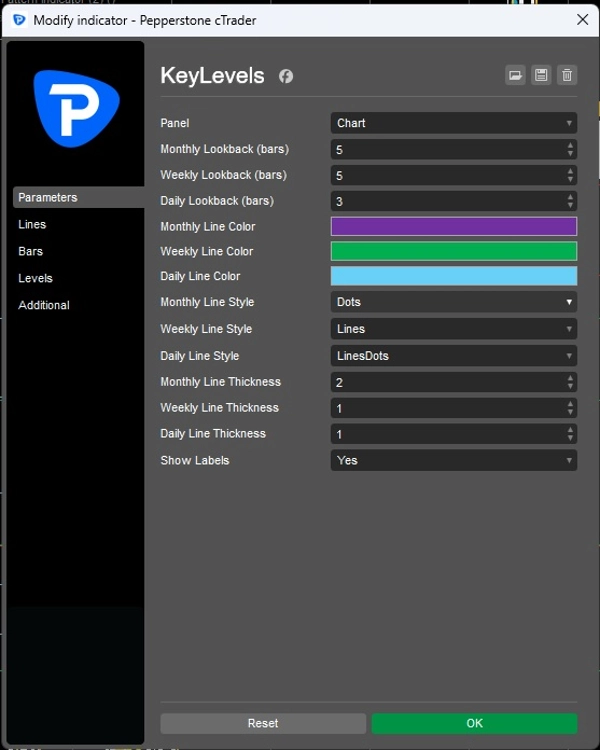
- 🔹 사용자 지정 조회 기간 – 각 타임프레임에 포함할 과거 바 수를 선택할 수 있습니다.
- 🔹 시각적 사용자 정의 – 월간, 주간, 일간 레벨에 대해 개별 색상, 선 스타일 및 두께를 설정할 수 있습니다.
- 🔹 라벨 옵션 – 각 레벨을 명확히 식별할 수 있도록 라벨을 켜거나 끌 수 있습니다.
- 🔹 동적 업데이트 – 새로운 바가 마감될 때마다 레벨이 자동으로 갱신됩니다.
- 🔹 깔끔한 차트 통합 – 선이 차트에 직접 그려져 쉽게 참조할 수 있습니다.
트레이더를 위한 이점
- 일중 설정을 객관적인 상위 타임프레임 레벨에 고정합니다.
- 중요한 구조적 포인트만 표시하여 규율과 확신 필터를 강화합니다.
- 레벨 표시를 자동화하여 시간을 절약합니다 — 더 이상 수동으로 그릴 필요가 없습니다.
- 여러 타임프레임 분석을 결합할 때 명확성을 향상시킵니다.
사용 사례
- 일중 스캘퍼는 일간 또는 주간 레벨과 진입을 맞출 수 있습니다.
- 스윙 트레이더는 월간 앵커를 추적하여 지속 설정을 할 수 있습니다.
- 플레이북 기반 트레이더는 지표를 통합된 체크리스트에 포함시켜 즉각적인 분류가 가능합니다.
요약
지표 프로필
고객 리뷰
0.0
리뷰: 0
고객 리뷰
이 상품에 대한 리뷰가 아직 없습니다. 이미 사용해 보셨나요? 다른 사람들에게 가장 먼저 소개해 주세요!
상담
자주 묻는 질문(FAQ)
BTCUSD
Forex
Signal
Breakout
Indices
EURUSD
Commodities
GBPUSD
NZDUSD
Prop
Scalping
Crypto
Stocks
XAUUSD
NAS100
USDJPY
트레이딩 봇, 지표, 플러그인 등 cTrader Store에서 제공되는 상품은 제3자 개발자에 의해 제공되며, 이는 단순히 정보 및 기술적 접근을 목적으로 제공된 것입니다. cTrader Store는 중개인이 아니며, 투자 조언, 개인별 추천 또는 향후 성과에 대한 어떠한 보장도 제공하지 않습니다.
이 작성자의 상품 더 보기


가격
가입일 24/04/2025
169.78M
거래량
17.75K
핍 수익
11
판매
328
무료 설치