
Opis
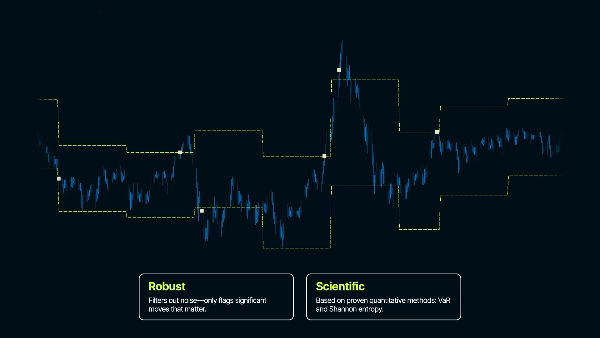
Wskaźnik Price Jump Exit and Re-entry (PjER) to wskaźnik zarządzania ryzykiem oparty na artykule naukowym „A dynamic price jump exit and reentry strategy for intraday trading” autorstwa Koegelenberga i van Vuurena (2024), opublikowanym w czasopiśmie Expert Systems With Applications.
Kluczowa innowacja
- Szacunki VaR potencjalnych strat zanim się pojawią
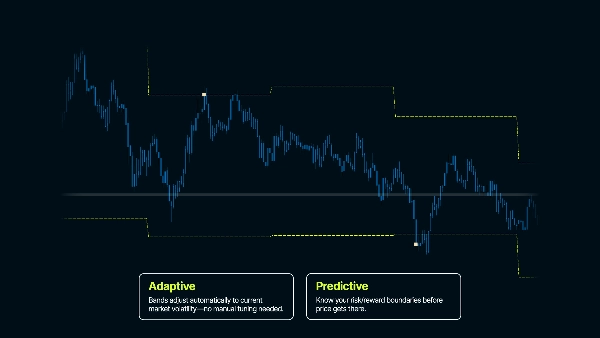
- Odporność na silne trendy rynkowe w krótkich ramach czasowych
- Analiza korekty rynku po skoku cenowym dla bezpiecznego momentu ponownego wejścia
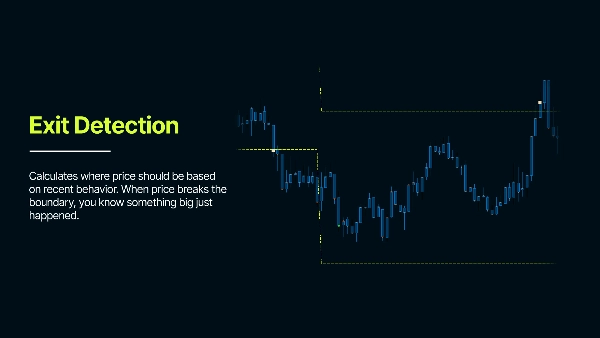
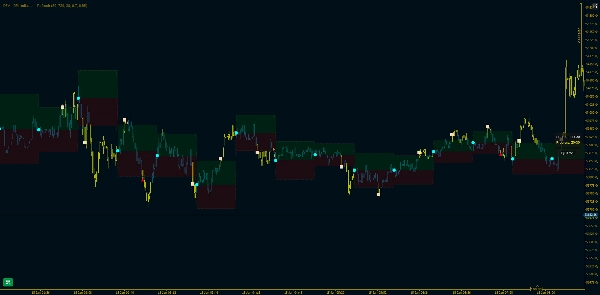
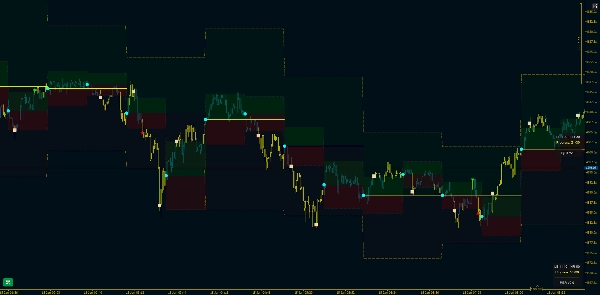
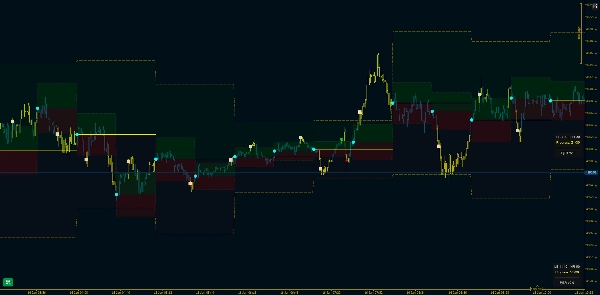
Analizuje przeszłe ruchy cen, aby zrozumieć typową zmienność i tworzy przedziały ufności - reprezentujące oczekiwany zakres cenowy. Gdy cena wychodzi poza te pasma, sygnalizuje, że wydarzyło się coś nieprawidłowego.
Docelowe zastosowanie
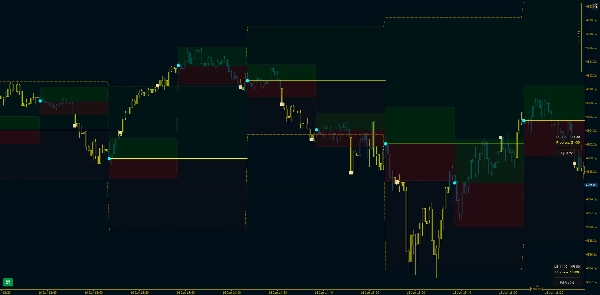
Trading intraday (szczególnie strategie oparte na zakresie). Ten wskaźnik tworzy statystyczne granice wokół ceny, aby wykrywać nietypowe ruchy cenowe. W normalnym zachowaniu rynku cena pozostaje w oczekiwanych zakresach opartych na ostatniej zmienności. Gdy cena przebija te pasma, sygnalizuje, że dzieje się coś niezwykłego - potencjalny punkt wyjścia z transakcji lub wybicie w strukturze rynku, ponieważ zachowanie rynku uległo zmianie.
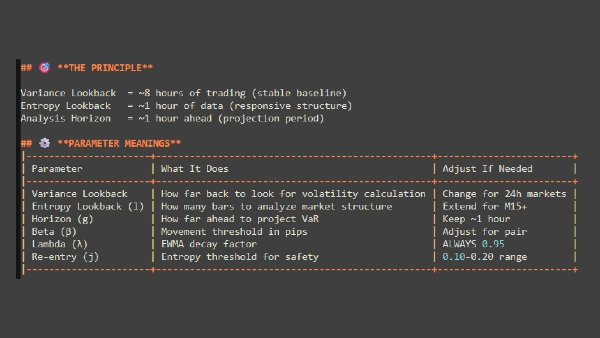
Wyjaśnienie podstawowych parametrów
Maksymalna liczba dni wstecz - Określa, jak daleko w historii wskaźnik zaczyna działać
Przesunięcie GMT - Dostosowuje do twojej strefy czasowej. Zapewnia, że obliczenia dat odpowiadają lokalnemu czasowi
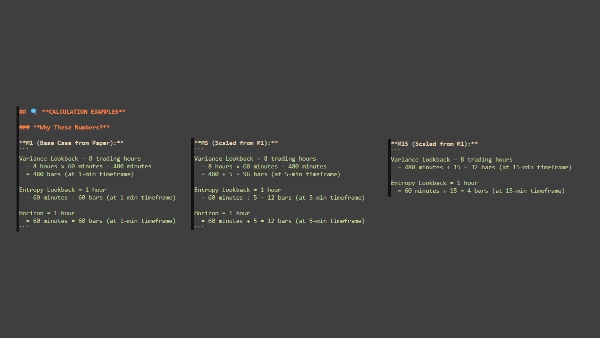
Okres retrospektywny (świece)
„Ile historii cen powinienem użyć do pomiaru 'normalnego' zachowania?”
- Ile świec danych historycznych użyć do obliczenia zmienności
- Więcej świec = bardziej stabilne, ale wolniejsze dostosowanie; mniej świec = szybsza reakcja, ale bardziej szumowa
- Przykład: 1440 świec na M1 = 24 godziny danych
Horyzont analizy (świece)
„Jak długo powinienem obserwować cenę, zanim zacznę od nowa?”
- Jak długo trwa każdy okres analizy przed zresetowaniem pasm
- Określa ramę czasową analizy - krótsza = częstsze resetowanie, dłuższa = pasma pozostają stałe dłużej
- Przykład: 60 świec = pasma pozostają przez 60 świec, potem przeliczane od nowej ceny referencyjnej
Prawdopodobieństwo ryzyka
„Jak bardzo chcę być pewny, że cena normalnie nie osiągnie tych poziomów?”
- Ustawia poziom ufności dla pasm (jak margines bezpieczeństwa)
- Wyższe wartości = szersze pasma (mniej sygnałów), niższe wartości = węższe pasma (więcej sygnałów)
- Przykład: 0.80 = 80% pewności, że cena pozostanie w pasmach w normalnych warunkach
Współczynnik zaniku (λ - Lambda)
„Czy powinienem bardziej zwracać uwagę na to, co właśnie się wydarzyło, czy traktować całą historię jednakowo?”
- Kontroluje, jaką wagę nadać ostatnim danym w porównaniu do starszych w obliczeniach zmienności
- Wyższe wartości = większe znaczenie ostatnich danych; niższe wartości = wszystkie dane ważone bardziej równomiernie
- Przykład 0.95 = ostatnia zmienność silnie wpływa na obliczenia
NAJWAŻNIEJSZE PUNKTY DO ZAPAMIĘTANIA
To jest narzędzie ZARZĄDZANIA RYZYKIEM – Identyfikuje zdarzenia zmienności i stabilność w okresach czasu
Przedziały ufności są kluczowe – Pasm nie należy prowadzić za ceną jak ATR – Pasm oblicza się dla każdego okresu analizy
Ponowne wejście wymaga cierpliwości – Nie oczekuj natychmiastowego ponownego wejścia po wyjściu – Rynek potrzebuje czasu na stabilizację
Parametry są specyficzne dla aktywów i ram czasowych – Domyślne parametry to punkty wyjścia – Optymalizuj dla swojego rynku i stylu – To, co działa na rynku FX, może nie działać na indeksach, metalach czy kryptowalutach.
( * ) Ten wskaźnik jest udostępniany wyłącznie w celach edukacyjnych i informacyjnych. Nie stanowi porady finansowej ani inwestycyjnej. Nic w tym produkcie, jego dokumentacji ani materiałach powiązanych nie powinno być interpretowane jako rekomendacja kupna, sprzedaży lub utrzymania jakiegokolwiek instrumentu finansowego. Handel na rynkach finansowych wiąże się ze znacznym ryzykiem i może nie być odpowiedni dla wszystkich inwestorów. Wyniki historyczne nie gwarantują przyszłych rezultatów. Nie ma gwarancji zysków, a użytkownicy mogą ponieść znaczne straty. Korzystając z tego wskaźnika, potwierdzasz, że jesteś wyłącznie odpowiedzialny za swoje decyzje handlowe i wyniki finansowe. Twórca tego produktu nie ponosi odpowiedzialności za jakiekolwiek straty lub szkody wynikające bezpośrednio lub pośrednio z jego użycia. Zawsze przeprowadzaj własną analizę przed podjęciem decyzji handlowych.
Podsumowanie
Key features include Value at Risk (VaR) estimates to anticipate potential losses, robustness against strong short-term trends, and analysis of post-jump corrections to identify safe re-entry timings. Core adjustable parameters allow users to tailor the indicator to specific assets and timeframes, including lookback period for volatility calculation, analysis horizon for band recalculation frequency, risk probability to set confidence levels, and decay factor to weight recent versus older data.
The indicator emphasizes patience for re-entry after exits, as market stabilization is required. It is intended as a tool for identifying volatility events and managing risk rather than providing direct trade signals. Users should optimize parameters according to their trading style and market conditions.
Opinie klientów
5 | 100 % | |
4 | 0 % | |
3 | 0 % | |
2 | 0 % | |
1 | 0 % |


