
Linear Regression Pro
지표
2 구매
버전 2.0, Jan 2026
Windows, Mac
5.0
리뷰: 1
설명
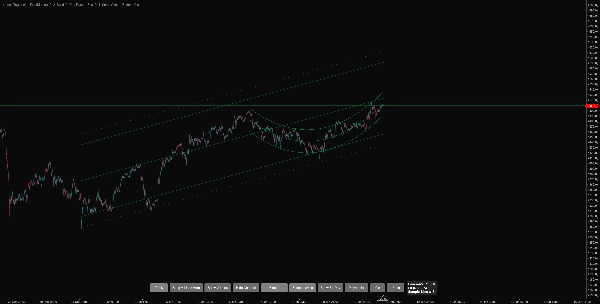
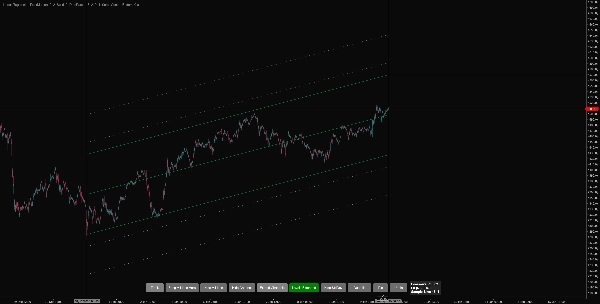
이것은 추세 식별과 변동성 분석에서 정밀함을 요구하는 트레이더를 위해 설계된 고급 선형 회귀 도구입니다. 단순 평균에 의존하는 일반 지표와 달리, 이 도구는 정교한 통계 알고리즘을 사용하여 시장의 "진정한 추세"를 시각화하고, 노이즈를 걸러내며, 높은 확률의 반전 구역을 식별합니다.
평균 회귀 스캘퍼든 추세 추종 스윙 트레이더든, 이 지표는 7가지 독특한 통계 엔진과 완전한 인터랙티브 인터페이스로 당신의 전략에 맞게 적응합니다.
이것은 문자 그대로 최고의 선형 회귀 지표입니다. 어떤 플랫폼을 사용하든 더 나은 것을 찾을 수 없습니다.
주요 특징
1. 스마트 메모리 및 지속성
분석을 다시는 잃지 마세요.
- 자동 저장: 지표는 활성 채널의 정확한 위치, 선호 설정, 그리고 모든 "고정된" 과거 채널을 자동으로 기억합니다.
- 세션 연속성: cTrader를 닫거나, 시간대를 변경하거나, 심볼을 바꿔도 분석이 정확히 중단한 지점에 그대로 유지됩니다.
2. 훌륭한 차트 내 컨트롤, 내장 편의 기능
설정 창을 뒤질 필요가 없습니다. 전용 컨트롤 패널로 차트에서 직접 지표를 관리할 수 있습니다:
- 추적 모드: 채널을 가장 최근 가격 움직임에 즉시 고정하며, 새 바가 생성될 때마다 자동으로 업데이트됩니다.
- 고정 및 해제: 완벽한 과거 추세를 찾았나요? "고정"을 클릭해 차트에 영구적으로 잠그세요. 실수했거나 잘못된 영역을 고정했나요? "해제" 버튼이 마지막으로 고정한 채널을 즉시 제거해 차트를 깔끔하게 유지합니다.
- 수직선 이곳으로 가져오기: 현재 뷰의 중앙으로 수직 선택선들을 즉시 이동시켜, 화면 밖으로 사라졌거나 너무 멀리 스크롤한 경우에도 다시 불러옵니다.
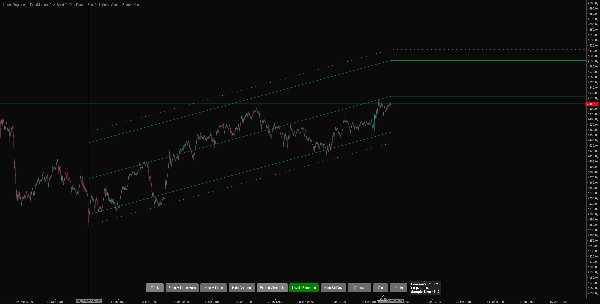
- 채널 확장: 현재 채널을 앞으로 투사합니다.
- 레벨 확장: 가장 최근 가격 레벨을 수평으로 앞으로 투사합니다.
- 자동 색상 지정: 추세 방향을 자동으로 감지하여 상승 및 하락 채널에 사용자 지정 색상을 적용합니다.
3. 실시간 통계 점수
추세가 유효한지 단순히 추측하지 말고 과학적으로 측정하세요.
- 적합도 미터: 지표가 패널에 실시간 통계 점수를 표시합니다.
-
- 피어슨 상관계수 R (상관관계)로 추세가 얼마나 조직적인지 정확히 알려줍니다 (예: -0.95는 완벽한 하락 추세).
- 적합도 R² (결정 계수)로 채널의 신뢰도를 나타냅니다.
- 전문가 팁: 이 점수를 사용해 거래를 필터링하세요. "적합도"가 0.70 미만이면 시장이 횡보 중이며, 0.90 또는 0.80 이상이면 강한 추세입니다.
4. 다차원 가격 분석
대부분의 지표는 "종가"만 봅니다. 이 도구는 가격 데이터를 해석하는 5가지 다른 방식을 제공하여 시장의 전체 변동성을 포착할 수 있습니다:
- 고밀도: 시가, 고가, 저가, 종가를 네 개의 별도 데이터 포인트로 처리하는 독특한 모드입니다. 이는 "꼬리"의 전체 변동성을 존중하는 채널을 만들어 더 안전한 진입 및 청산 지점을 제공합니다.
- 중간값 / 전형값 / 평균: 캔들 노이즈를 부드럽게 하여 더 명확한 신호를 제공합니다.
회귀 엔진 설명
이 지표는 특정 시장 상황에 맞게 설계된 8가지 독특한 수학 모델을 포함합니다:
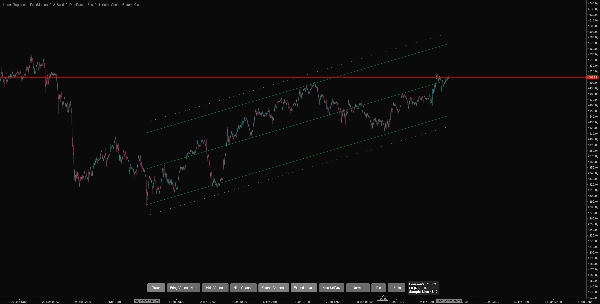
- 일반 (OLS): 표준 "최적 적합" 선입니다. 건강한 시장에서 일반적인 추세 방향과 평균 회귀 전략에 이상적입니다.
- 래프 채널: Gilbert Raff의 연구를 기반으로 합니다. 표준 편차 대신 가격이 선에서 최대 거리만큼 떨어진 범위를 사용해 모든 가격 움직임을 포함하는 채널을 만듭니다. 추세의 절대 범위를 결정하는 데 탁월합니다.
- 강건 회귀: 이상치에 강합니다. 극단적인 급등과 "꼬리"를 무시하고 가격 움직임의 핵심 몸통을 통과하는 선을 그립니다. 뉴스 이벤트 필터링에 완벽합니다.
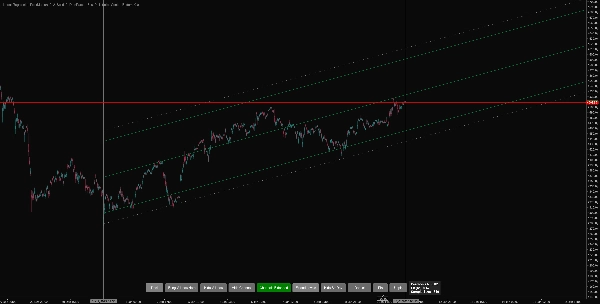
- 가중 회귀: 최근 가격에 더 큰 중요도를 부여합니다. 이는 표준 회귀보다 추세 변화에 더 빠르게 반응하는 채널을 만듭니다.
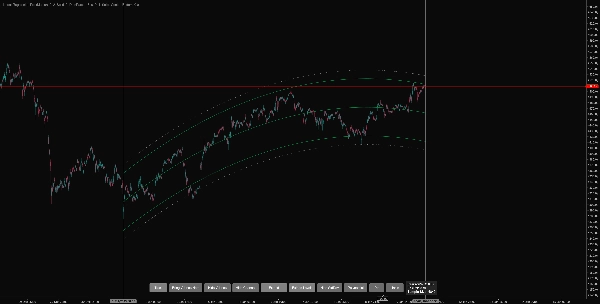
- 다항식: 비선형 곡선 회귀입니다. 이 유연한 모델은 직선으로는 포착할 수 없는 복잡한 시장 구조에 맞게 굽어집니다.
- Theil-Sen 추정기: 모든 가능한 점 쌍의 "중간 기울기"를 찾는 비모수적 방법입니다. 시장 노이즈와 급락 이벤트에 매우 강건하며, 종종 "진정한" 구조적 추세를 드러냅니다.
- 분위수 회귀: "평균"(산술 평균) 대신 "중간값"(50번째 백분위수)에 적합합니다. 가격 움직임을 정확히 반으로 나누는 채널을 그려 공정 가치 분석을 위한 매우 정확한 중심선을 제공합니다.
- RANSAC (랜덤 샘플 합의): 데이터의 무작위 하위 집합에서 모델을 반복적으로 구축하는 방법입니다. "노이즈"를 적극적으로 걸러내 지배적인 추세를 찾아내며, 혼란스럽거나 횡보하는 가격 움직임 속에 숨겨진 명확한 시장 구조를 식별하는 데 탁월합니다.
요약
지표 프로필
고객 리뷰
5.0
리뷰: 1
5 | 100 % | |
4 | 0 % | |
3 | 0 % | |
2 | 0 % | |
1 | 0 % |
고객 리뷰
January 28, 2026
Linear Regression Pro offers deep trend analysis with regression channels and deviation bands. Best suited for H1 and higher timeframes, where structure and slope are clearly visible. On lower TFs the chart can feel overloaded. A powerful tool for trend-focused traders.
상담
자주 묻는 질문(FAQ)
Forex
Signal
트레이딩 봇, 지표, 플러그인 등 cTrader Store에서 제공되는 상품은 제3자 개발자에 의해 제공되며, 이는 단순히 정보 및 기술적 접근을 목적으로 제공된 것입니다. cTrader Store는 중개인이 아니며, 투자 조언, 개인별 추천 또는 향후 성과에 대한 어떠한 보장도 제공하지 않습니다.


좋아하실 만한 다른 항목


가격
237.59M
거래량
1.83M
핍 수익
2
판매
4.62K
무료 설치