
الوصف
📊 مؤشر COT التاريخي برو — تدفق الممثل + الاتجاه (المؤسساتي / المتحوطون / التجزئة)
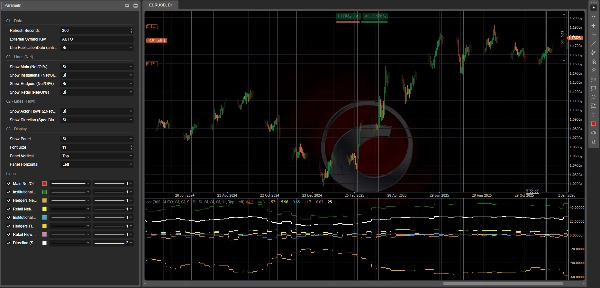
CotIndicatorHistoryPro يقدم قراءة متقدمة لالتزامات المتداولين (COT) مباشرة على الرسم البياني الخاص بك، مع تقسيم واضح حسب المشاركين في السوق (المؤسساتي، المتحوطون/التجاريون، التجزئة).
يعرض ليس فقط مكان تموضع كل ممثل (طويل/قصير في الغالب)، بل أيضاً ما يفعلونه الآن (زيادة المراكز الطويلة أو القصيرة)، بالإضافة إلى خط الاتجاه الاصطناعي لتسليط الضوء على الانحياز السائد.
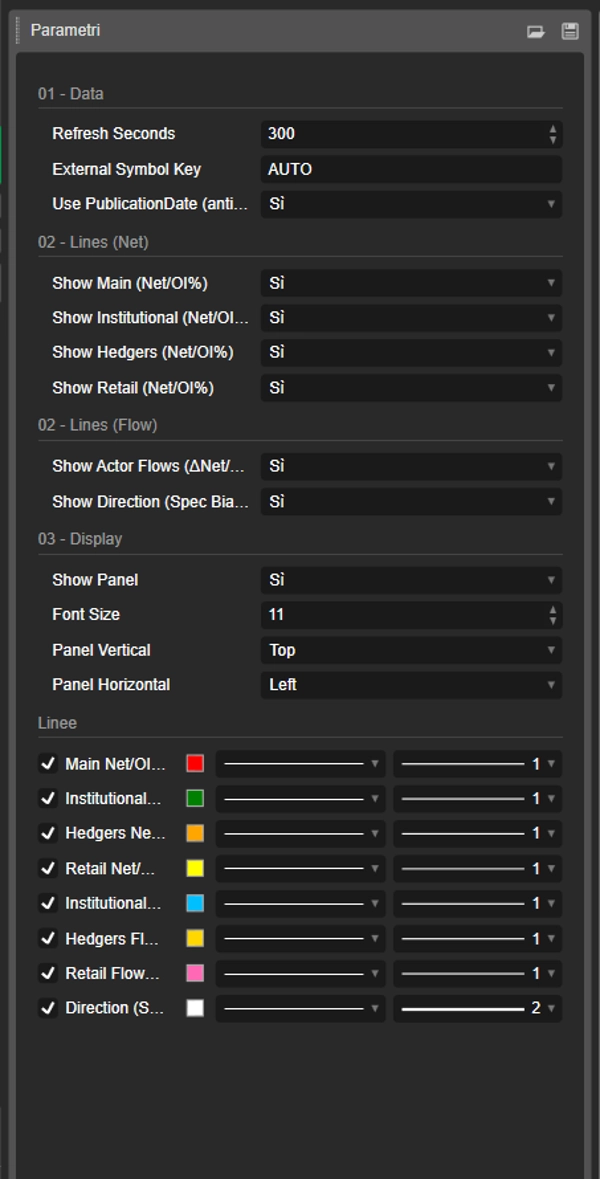
يقوم المؤشر بتحميل مجموعة بياناته من تغذية JSON مؤمنة (التاريخ + المخرجات) ويقوم بمحاذاتها بأمان على الرسم البياني (خيار مضاد للنظر المستقبلي باستخدام تاريخ النشر).
🗓️ تحديث البيانات الأسبوعي (الجمعة 21:00)
يتم تحديث مجموعة بيانات COT كل يوم جمعة الساعة 21:00 (توقيت أوروبا/روما) بفضل خط أنابيب أتمتة مخصص:
يقوم برنامج معالجة متطور بإجراء الحسابات و نشر القيم المحدثة إلى تغذية JSON التي يستخدمها المؤشر (ونظام cBot المرتبط إذا تم تثبيته).
✅ يقوم المؤشر نفسه بالتحديث على المنصة باستخدام إعداد ثواني التحديث الخاص بك وسيعرض البيانات الأسبوعية الجديدة بمجرد نشرها.
✅ ما تحصل عليه (الخطوط + اللوحة)
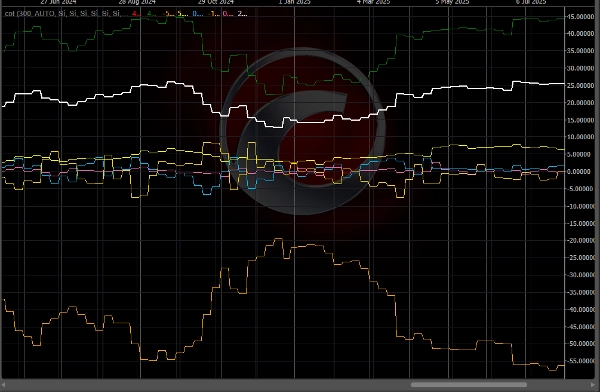
🔥 خطوط "التدفق" (3 ممثلين) — Δصافي/نسبة الفائدة المفتوحة%
تمثل هذه الخطوط التغير الأسبوعي في المراكز الصافية، مع تطبيع حسب الفائدة المفتوحة:
- 🔵 تدفق المؤسسات (Δصافي/نسبة الفائدة المفتوحة%)
- 🟡 تدفق المتحوطين / التجاريين (Δصافي/نسبة الفائدة المفتوحة%)
- 💗 تدفق التجزئة (Δصافي/نسبة الفائدة المفتوحة%)
📌 كيفية قراءته:
- أعلى من 0 ⇒ الممثل يزيد المراكز الصافية الطويلة (يضيف مراكز طويلة و/أو يغطي مراكز قصيرة)
- أقل من 0 ⇒ الممثل يزيد المراكز الصافية القصيرة (يضيف مراكز قصيرة و/أو يقلل مراكز طويلة)
- القيم المطلقة الأكبر (مثلاً ±1.5%، ±3%) ⇒ تغييرات تموضع أقوى وأكثر معنى
🧭 خط "الاتجاه" — انحياز المضاربين صافي/نسبة الفائدة المفتوحة%
- ⚪ الاتجاه (انحياز المضاربين) صافي/نسبة الفائدة المفتوحة% يلخص الاتجاه "المضاربي" السائد (متوسط المؤسسات + التجزئة، مع بديل إذا لزم الأمر).
📌 كيفية قراءته:
- > 0 ⇒ انحياز مضاربي طويل
- < 0 ⇒ انحياز مضاربي قصير
- ≈ 0 ⇒ مرحلة مستوية / محايدة
🧩 لوحة المعلومات (السياق الكامل)
تعرض لوحة مدمجة:
- 📄 تاريخ التقرير / تاريخ النشر
- 📌 الفائدة المفتوحة + التغير الأسبوعي (الأسبوع مقابل الأسبوع)
- 🎯 إشارة نصية (إذا كانت متاحة في المخرجات)
- لكل ممثل:
-
- الانحياز (طويل / قصير / مستوي في الغالب) بناءً على الصافي
- صافي/نسبة الفائدة المفتوحة%
- التدفق (Δصافي/نسبة الفائدة المفتوحة%)
- التغير الأسبوعي Δطويل / Δقصير / Δصافي لفهم كيف تغيرت المراكز
🧠 كيفية قراءته (بسيط وعملي)
✅ التدفق مقابل الانحياز (الفرق الرئيسي)
- التدفق = ما يفعلونه الآن (إضافة مراكز طويلة أو قصيرة)
- الانحياز = كيف تموضعوا بشكل عام (طويل أو قصير في الغالب)
مثال:
- المؤسساتي انحياز طويل + تدفق إيجابي ⇒ لا يزالون يدفعون نحو المراكز الطويلة
- المؤسساتي انحياز طويل + تدفق سلبي ⇒ تقليل المراكز الطويلة / احتمال دوران
🚦 سيناريوهات تداول نموذجية
✅ السيناريو أ — تأكيد الاتجاه
- الاتجاه > 0
- تدفق المؤسسات > 0
➡️ ضغط الشراء طويل مستمر: غالباً إعداد استمرارية.
✅ السيناريو ب — احتمال انعكاس (المال الذكي مقابل التجزئة)
- تدفق المؤسسات > 0 بينما تدفق التجزئة < 0
➡️ التجزئة يبيعون/يقصرون بينما المؤسسات تشتري: احتمال تراكم.
(العكس = احتمال توزيع)
✅ السيناريو ج — المتحوطون كـ "تنبيه"
- المتحوطون عند مستويات قصوى (صافي/نسبة الفائدة المفتوحة بعيد عن الحياد) + تدفق قوي
➡️ احتمال منطقة زائدة / تحوط عدواني (غالباً أفضل كتحذير من كونه إشارة دخول مباشرة).
✅ السيناريو د — "تحميل" السوق (خطر الاختراق)
- تدفق قوي + ارتفاع الفائدة المفتوحة أسبوعياً
➡️ دخول مراكز جديدة: غالباً ما تزداد احتمالية تحركات ممتدة.
⚡ روتين قراءة 10 ثواني
- تحقق من الاتجاه: طويل (>0) أم قصير (<0)
- تحقق من تدفق المؤسسات: يؤكد أم يتباعد؟
- تحقق من تدفق التجزئة: يؤكد أم يعكس؟
- تحقق من الفائدة المفتوحة أسبوعياً: توسع أم تفكيك مراكز؟
✅ الرموز المدعومة + الأسطورة الرئيسية (مفاتيح رموز JSON)
يمكن للمؤشر تحليل أي أداة متاحة في تغذية JSON (الحقل data[].symbol في المخرجات).
كيفية اختيار الأداة الصحيحة
- مفتاح الرمز الخارجي = AUTO 👉 يستخدم تلقائياً رمز الرسم البياني (ويزيل أي لاحقة بعد “.”، مثلاً
US2000.ecn→US2000). - إذا كان وسيطك يستخدم أسماء رموز مختلفة 👉 قم بتعيين مفتاح الرمز الخارجي إلى المفتاح الدقيق في JSON (غير حساس لحالة الأحرف).
المفاتيح الحالية في التغذية (لقطة مثال: reportDate 2026-02-17، publicationDate 2026-02-20)
- الفوركس:
AUDUSD،EURUSD،GBPUSD،USDMXN - المؤشرات:
US100،US2000،DOW30،VIX - السلع/المعادن/الزراعة:
BRENT،WTI،COPPER،CORN،WHEAT،XAU(ذهب)،XAG(فضة) - العملات الرقمية:
BTC،ETH
📌 إذا لم تظهر القيم على الرسم البياني:
- تحقق من تطابق رمز الرسم البياني مع مفتاح JSON
- قم بتعيين مفتاح الرمز الخارجي يدوياً (مثلاً
ETH،US2000) - تحقق من لوحة تاريخ التقرير/النشر لتأكيد تحميل أحدث مجموعة بيانات
⚙️ ملاحظات
- يدعم محاذاة أكثر أماناً مع استخدام تاريخ النشر (مضاد للنظر المستقبلي) ✅
- يمكن تمكين/تعطيل الخطوط واللوحة بشكل فردي.
📌 إخلاء المسؤولية: مؤشر معلوماتي فقط، وليس نصيحة مالية. بيانات COT أسبوعية ويجب تفسيرها ضمن السياق مع الاتجاه، المستويات الرئيسية، والتقلب.
الملخص
The indicator sources data from a secured JSON feed updated every Friday at 21:00 (Europe/Rome time) and aligns it on the chart using publication dates to prevent lookahead bias. Users can view flow lines for each actor, a direction line indicating overall market bias, and an info panel detailing report dates, open interest, net positions, and weekly changes.
It supports a wide range of instruments including Forex pairs (e.g., EURUSD, GBPUSD), indices (e.g., US100, DOW30), commodities (e.g., Brent, Gold), and cryptocurrencies (BTC, ETH). Symbol selection can be automatic or manually set to match feed keys.
Typical use cases include trend confirmation, spotting potential reversals by comparing smart money and retail flows, hedger activity alerts, and breakout risk assessment based on open interest changes. The indicator is informational and designed to complement other technical analysis tools.
تقييمات العملاء
5 | 50 % | |
4 | 50 % | |
3 | 0 % | |
2 | 0 % | |
1 | 0 % |


