
Penerangan
Toolkit Sokongan & Rintangan adalah penunjuk analisis struktur pasaran yang komprehensif yang direka untuk membantu pedagang mengenal pasti zon sokongan dan rintangan berkemungkinan tinggi pada carta. Dengan menggabungkan pelbagai algoritma pengesanan titik pivot canggih dengan zon volatiliti adaptif, penapis aliran wang institusi, dan analisis kecairan, toolkit ini mengubah garis sokongan dan rintangan tradisional menjadi alat strategik berasaskan data.
Pengesanan
Toolkit ini merangkumi empat metodologi pengesanan canggih yang direka untuk sesuai dengan gaya dagangan dan persekitaran pasaran yang berbeza:
- Pivot: Pendekatan pengesanan sokongan dan rintangan klasik menggunakan kekuatan pandangan ke kiri dan kanan yang boleh dikonfigurasi untuk mengesan tinggi dan rendah tempatan.
- Donchian: Algoritma mesin keadaan berprestasi tinggi yang mengesan struktur ayunan bergantian. Daripada menggunakan kelewatan tetap, ia mengesahkan ekstrem apabila pasaran mengubah keadaan arah.
- CSID:Kaedah pengesanan berasaskan momentum yang mengenal pasti titik perubahan struktur berdasarkan lilin bullish atau bearish berturut-turut, menonjolkan zon permulaan tren yang kuat.
- ZigZag:Algoritma berasaskan volatiliti yang menapis turun naik harga kecil dengan memerlukan penyimpangan peratusan minimum sebelum mengenal pasti ayunan.
Zon / Tahap
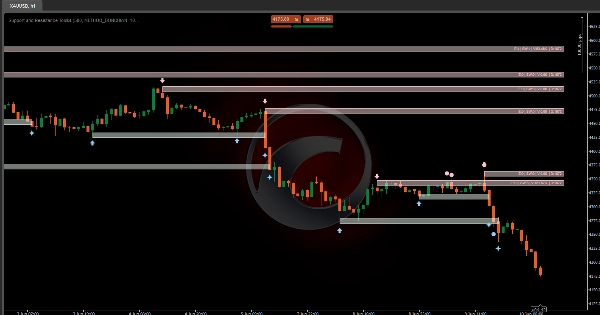
Tidak seperti penunjuk konvensional yang hanya melukis garis tetap, alat ini menganggap tahap sokongan dan rintangan sebagai zon harga dinamik berdasarkan ciri-ciri berikut:
- Kedalaman Zon (ATR Mult): Menentukan ketebalan setiap zon berdasarkan Julat Benar Purata. Ini membolehkan zon menyesuaikan secara automatik dengan volatiliti pasaran.
- Penampan Pecahan (ATR Mult): Penampan keselamatan unik yang meluaskan zon melepasi sisi pecahan. Harga mesti bergerak melepasi lapisan volatiliti tambahan ini sebelum penunjuk mengesahkan pecahan, mengurangkan isyarat palsu dan penipuan.
Penapisan & Kebolehlihatan:
- Gabungkan Bertindih: Menggabungkan zon yang bertindih menjadi “Super Zon” yang lebih besar yang mewakili julat interaksi sejarah penuh.
- Sembunyikan Yang Tertua Dahulu: Memberi keutamaan kepada struktur pasaran terkini dengan menyembunyikan zon lama apabila berlaku pertindihan.
- Sembunyikan Yang Termuda Dahulu: Memelihara struktur sejarah yang telah ditetapkan dengan mengabaikan zon baru yang lebih kecil yang muncul dalam julat sedia ada.
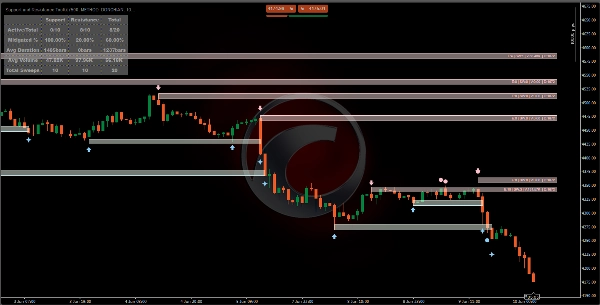
Penapisan Tahap ( E:Entri | S:Kekuatan | SW:Sapuan | V:Isipadu | D:Tempoh )
- Entri Harga (E): Memerlukan tahap diuji semula sejumlah kali tertentu sebelum muncul pada carta.
- Sapuan (SW): Mengesan perangkap kecairan di mana harga seketika melanggar tahap dengan sumbu tetapi ditutup kembali di dalam zon.
- Isipadu Dagangan (V): Mengesan jumlah isipadu dagangan yang berlaku semasa harga berinteraksi dengan zon, menonjolkan penyertaan institusi.
- Tempoh (D): Memerlukan zon bertahan untuk jumlah bar minimum sebelum dianggap sebagai tahap struktur yang sah.
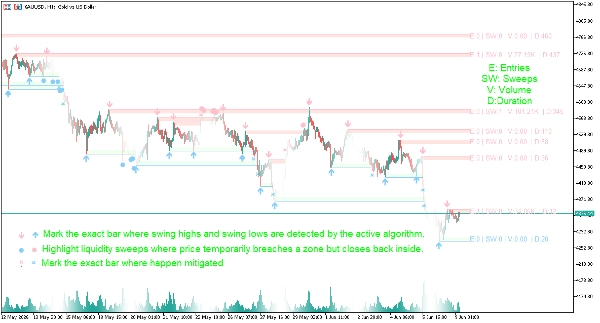
Isyarat Visual
- ⬆/⬇ Anak Panah: Menandakan bar tepat di mana tinggi dan rendah ayunan dikesan oleh algoritma aktif.
- ● Titik Besar: Menonjolkan sapuan kecairan di mana harga sementara melanggar zon tetapi ditutup kembali di dalamnya.
- ✖ Salib: Menandakan bar tepat di mana tinggi dan rendah ayunan dipindahkan.
- Label ringkasan: Setiap kawasan paparan menampilkan label data ringkas termasuk parameter E (Entri), S (Kekuatan), SW (Sapuan), V (Isipadu), dan D (Tempoh), membolehkan pengguna menilai kualiti struktur dengan cepat.
Papan Pemuka
- Aktif / Jumlah: Memaparkan berapa banyak struktur yang sedang aktif berbanding jumlah yang dikesan secara sejarah.
- Peratusan Mitigasi: Mengukur kekerapan tahap dipecahkan atau dimitigasi, memberikan pandangan tentang kebolehpercayaan struktur pasaran.
- Tempoh Purata: Purata bilangan bar zon sokongan atau rintangan bertahan sebelum dipecahkan.
- Isipadu Purata: Menunjukkan purata penyertaan institusi dalam zon sebelum berlaku pecahan.
- Jumlah Sapuan: Mengesan tingkah laku memburu kecairan di seluruh pasaran.
Tetapan Penunjuk
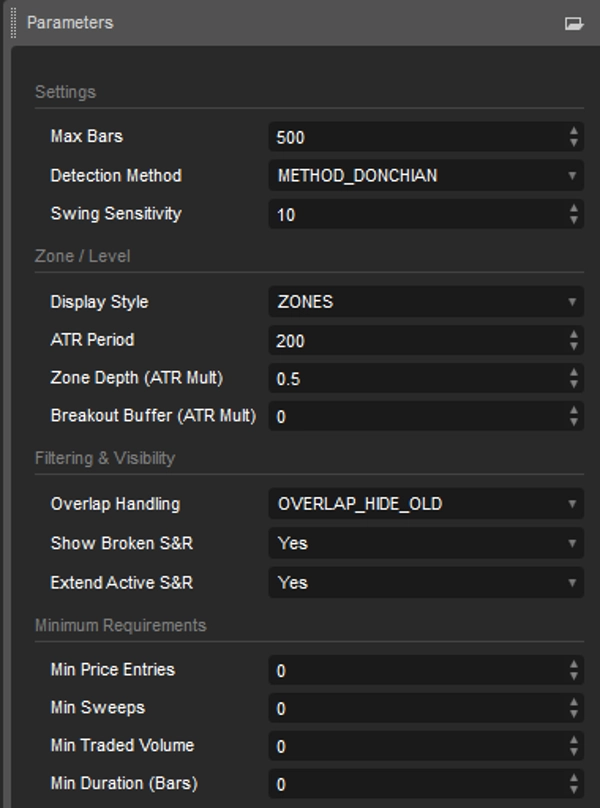
Tetapan Pengesanan
- Kaedah Pengesanan: Pilih antara logik pengesanan ayunan Pivots, Donchian, CSID, atau ZigZag.
- Sensitiviti Ayunan: Laraskan penyimpangan atau panjang pandangan yang diperlukan untuk mengesahkan tinggi dan rendah ayunan.
Konfigurasi Zon & Tahap
- Gaya Paparan: Tukar antara garis sokongan dan rintangan mendatar yang tepat atau zon berasaskan ATR.
- Tempoh ATR: Menentukan tempoh volatiliti yang digunakan untuk pengiraan zon.
- Kedalaman Zon (ATR Mult): Laraskan ketebalan zon sokongan dan rintangan.
- Penampan Pecahan (ATR Mult): Menambah penampan volatiliti untuk menapis pecahan palsu.
Kawalan Kebolehlihatan & Struktur Carta
- Pengendalian Pertindihan: Pilih bagaimana zon bertindih dikendalikan (Gabungkan, Sembunyikan Yang Tertua, atau Sembunyikan Yang Termuda).
- Maksimum Aktif (Tidak Dimitigasi): Hadkan bilangan zon sokongan dan rintangan aktif yang dipaparkan pada carta.
- Tunjukkan S&R Pecah: Togol sama ada tahap yang pecah kekal kelihatan untuk analisis sejarah.
- Lanjutkan S&R Aktif: Meramalkan tahap aktif ke bar harga masa depan.
Keperluan Struktur Minimum
- Min Entri Harga: Tetapkan bilangan ujian semula yang diperlukan sebelum tahap menjadi kelihatan.
- Min Sapuan: Memerlukan sejumlah sapuan kecairan tertentu sebelum memaparkan zon.
- Min Isipadu Dagangan: Memastikan zon memenuhi ambang penyertaan institusi minimum.
- Min Tempoh (Bar): Memerlukan tahap wujud untuk sejumlah bar tertentu sebelum ia muncul.
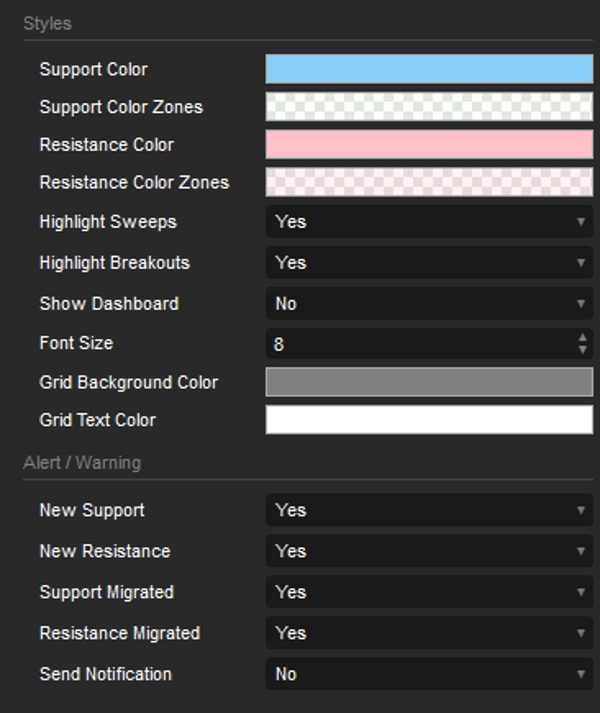
Gaya dan Amaran
- Gaya: Laraskan konfigurasi warna objek. Sembunyikan/Tunjukkan Papan Pemuka.
- Amaran: Hidupkan/matikan amaran setiap kali S&R baru dikesan atau S&R dipindahkan.
Ringkasan
Unlike traditional fixed lines, this tool defines support and resistance as dynamic price zones, with thickness and breakout buffers scaled by Average True Range (ATR) to adapt to market volatility. It features zone merging and selective visibility options to manage overlapping zones, prioritizing recent or historical structures as needed.
The indicator applies multiple filters based on price re-tests, liquidity sweeps, traded volume, and zone duration to validate structural levels. Visual signals include arrows marking swing points, dots highlighting liquidity sweeps, crosses for migrated swings, and summary labels displaying entries, strength, sweeps, volume, and duration metrics.
A dashboard provides real-time statistics on active versus total structures, mitigation percentages, average zone duration, volume, and liquidity sweep counts. Users can customize detection methods, sensitivity, zone display styles, ATR parameters, overlap handling, and structural requirements. Alerts can be enabled for new or migrated support and resistance levels.
This toolkit supports detailed market structure analysis with data-driven, volatility-adjusted zones to assist traders in identifying key price areas.


