present
Kaydolun ve ilk alışverişinizde $50 indirim kazanın
Trading product for Supply Demand Quadra Zones Gösterge EMA Key Levels, image 1
Supply Demand Quadra Zones
Gösterge
1 satın almalar
Sürüm 1.0, Sep 2026
Windows, Mac
Trading product for Supply Demand Quadra Zones Gösterge EMA Key Levels, image 2
Trading product for Supply Demand Quadra Zones Gösterge EMA Key Levels, image 3
Trading product for Supply Demand Quadra Zones Gösterge EMA Key Levels, image 4
Trading product for Supply Demand Quadra Zones Gösterge EMA Key Levels, image 5
Trading product for Supply Demand Quadra Zones Gösterge EMA Key Levels, image 6
Trading product for Supply Demand Quadra Zones Gösterge EMA Key Levels, image 7
Trading product for Supply Demand Quadra Zones Gösterge EMA Key Levels, image 8
Trading product for Supply Demand Quadra Zones Gösterge EMA Key Levels, image 9
Trading product for Supply Demand Quadra Zones Gösterge EMA Key Levels, image 10
Trading product for Supply Demand Quadra Zones Gösterge EMA Key Levels, image 11
12
Satışlar
216
Ücretsiz yüklemeler

Açıklama

Supply Demand Quadra Zones, bir giriş sinyali, çizilmiş bir risk planı ve daha geniş piyasa bağlamınızı tek bir grafik üzerinde gösterir.


NE ÇİZER


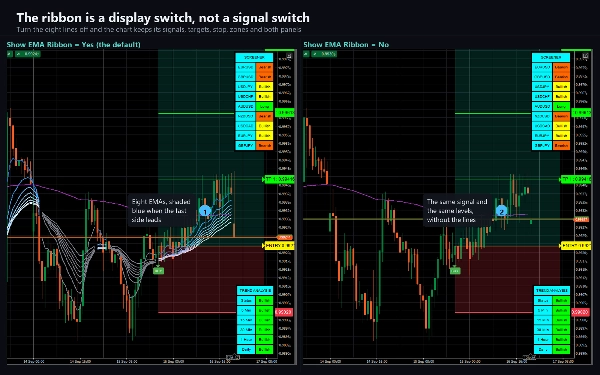
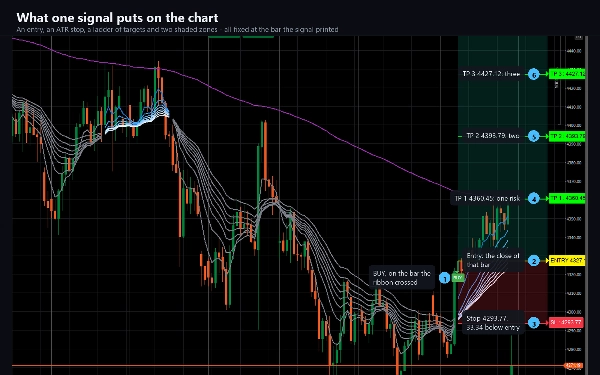
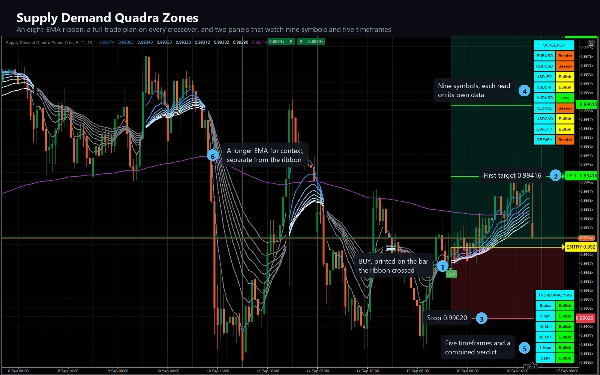
Hızlı bacak önde olduğunda maviye dönen ve olmadığında gri olan sekiz çizgili bir EMA şeridi (5, 11, 15, 18, 21, 24, 28, 34) ve ayrıca 200 periyotluk bir referans çizgisi. EMA 2, EMA 8'in üzerine çıktığında bir ALIŞ plakası çizilir; geri geçtiğinde ise SATIŞ plakası görünür.


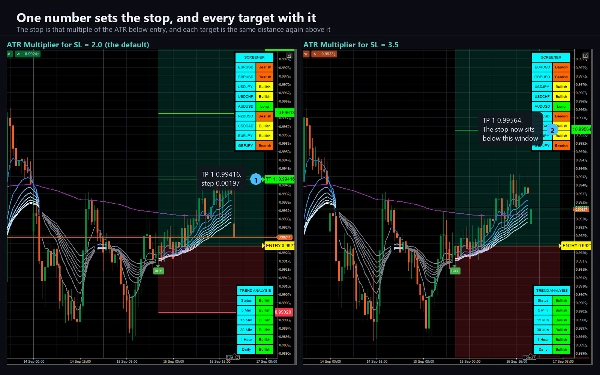
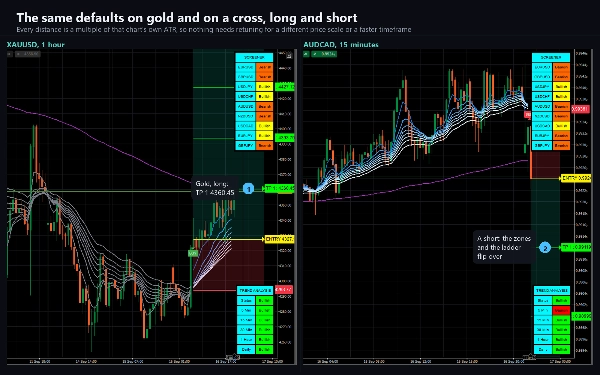
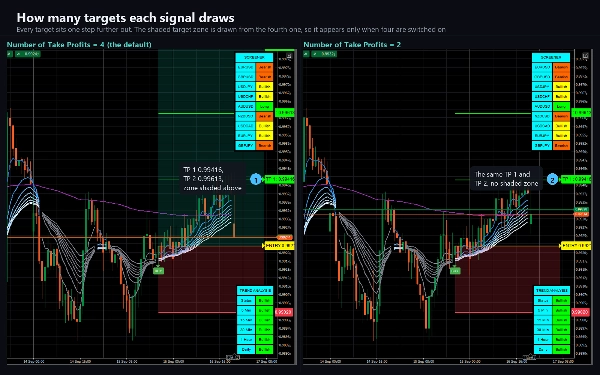
Her sinyal, grafikte zaten tam bir risk planı ile gelir: bir giriş çizgisi, ATR katmanı olarak yerleştirilmiş bir stop ve o stop mesafesinin katları olarak aralıklı dört kar alma seviyesi. Varsayılan ayarlarda merdiven 1R, 2R, 3R ve 4R'dir. Her seviye, sağ kenarda kendi fiyat etiketiyle gösterilir ve giriş ile hedef arasındaki alan ile giriş ve stop arasındaki alan gölgelenir, böylece işlemin şekli bir bakışta okunabilir. Tüm plan fiyatla birlikte ilerler ve işlem sonuçlandığında - ya stopa dokunulduğunda ya da etkinleştirilmiş tüm hedeflere ulaşıldığında - donar.


İKİ PANEL


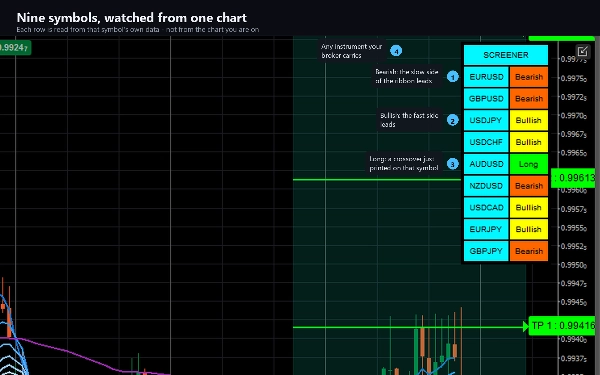
Bir tarayıcı, seçtiğiniz dokuz sembole kadar olanları - hepsi grafiğin kendi zaman diliminde okunur - Uzun, Kısa, Boğa veya Ayı olarak sınıflandırır, böylece dokuz grafik açmadan hangi diğer piyasaların aynı şekilde sıralandığını görebilirsiniz.


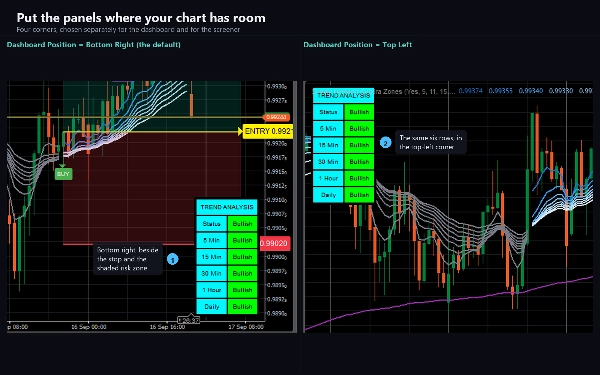
Bir trend paneli, grafik sembolü için 5 dakikalık, 15 dakikalık, 30 dakikalık, 1 saatlik ve günlük yönü bildirir, ayrıca seçtiğiniz üç zaman diliminin çoğunluk oyu ile belirlenen birleşik bir Durum satırı sunar.


WEBHOOK


Her sinyal ve onu takip eden işlemin her adımı, seçtiğiniz bir URL'ye JSON olarak POST edilebilir - böylece harici bir bot, günlük veya bildirim servisi grafiği izlemeksizin işlem yapabilir. Taraf, giriş, stop ve tam hedef merdiveni gönderilir, ardından her hedefe ulaşıldığında, stop için ve işlem kapandığında bir mesaj gönderilir. URL doldurulana kadar kapalıdır, geçmiş yüklenirken veya geriye dönük test sırasında asla tetiklenmez ve yükseltilmiş izinlere ihtiyaç duymaz.


Uyarılar ayrıca cTrader günlüğü, bir ses ve e-posta yoluyla iletilir.


YENİDEN ÇİZİM, AÇIKÇA BELİRTİLDİĞİ GİBİ


ALIŞ ve SATIŞ sinyalleri yeniden çizilmez. Kapalı barlar üzerinde kararlaştırılır ve çizildikten sonra asla hareket etmezler.


İki panel yeniden çizilir. Her ikisi de canlı bar üzerinde çizilir ve gelişmekte olan daha yüksek zaman dilimi verilerini okur, bu yüzden hücreleri o barlar kapanana kadar değişebilir. Bunları olanların kaydı olarak değil, mevcut durumun canlı resmi olarak değerlendirin.


AYARLAR


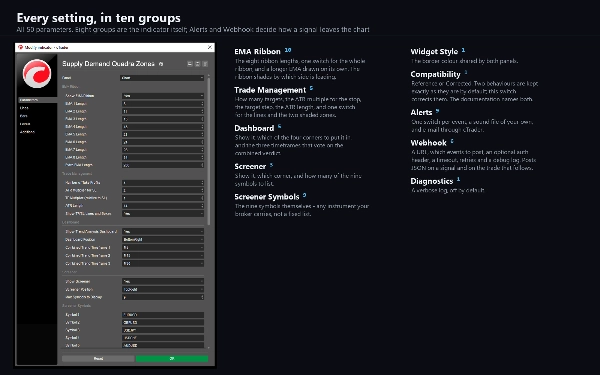
50 parametre. Tüm sekiz şerit uzunluğu, ATR çarpanı ve hedef aralığı, hedef sayısı, her iki panel pozisyonu, dokuz tarayıcı sembolü, üç panel zaman dilimi, sınır rengi, uyarı kanalları ve webhook. Uyumluluk ayarı, 4 saatlik panel seçeneği ve gölgeli hedef bölgesi için iki davranış arasında seçim yapar - dokümantasyon her birinin ne yaptığını ve neden varsayılanın böyle olduğunu tam olarak açıklar.


UYGUN OLDUĞU


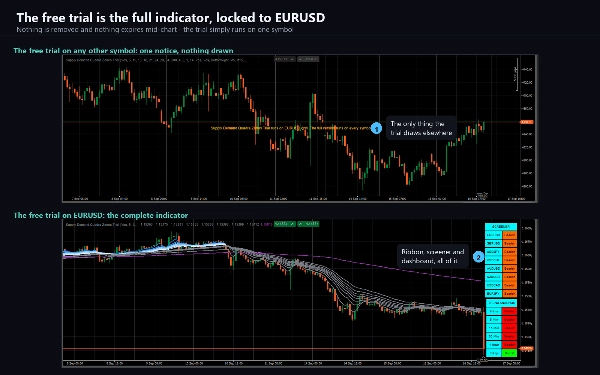
Platformun sunduğu herhangi bir enstrüman ve herhangi bir zaman dilimi. Şerit tamamen oluşmadan önce 34 bar ve referans çizgisi için 200 bar gerekir, bu yüzden çok kısa geçmişler uzun olanlardan daha az çizgi gösterecektir.


Ticaret risk içerir. Geçmiş performans gelecekteki sonuçları garanti etmez.

Özet

AI summary
Supply Demand Quadra Zones is a trading indicator designed for use on any instrument and timeframe supported by the platform. It features an eight-line Exponential Moving Average (EMA) ribbon (periods 5, 11, 15, 18, 21, 24, 28, 34) that visually signals trend direction by changing color: blue when the fast leg leads and grey otherwise, alongside a 200-period reference line. Buy and sell signals are generated when the second EMA crosses the eighth EMA, with entry points marked on the chart.

Each trade signal includes a comprehensive risk plan displayed directly on the chart, consisting of an entry line, a stop loss set at a multiple of the Average True Range (ATR), and up to four take-profit levels spaced by multiples of the stop distance. These levels are visually shaded and labeled with price tags for clarity. The risk plan dynamically tracks price movement and freezes upon trade resolution.

The product also includes two panels: a screener monitoring up to nine user-selected symbols on the current timeframe, classifying them as Long, Short, Bullish, or Bearish; and a trend dashboard showing directional trends across five timeframes (5m, 15m, 30m, 1h, daily) with a combined status based on a majority vote of three user-chosen timeframes.

Signals and trade steps can be sent as JSON via webhook to external services for automation or logging. Alerts are available through platform logs, sound, and email. Buy and sell signals are confirmed on closed bars and do not repaint, while the screener and dashboard update live and may change until bar close. The indicator offers extensive customization with 50 parameters covering ribbon settings, ATR multiples, target spacing, panel positions, symbols, alert channels, and webhook configuration.

Gösterge profili
Gösterge kategorisi
Trend
Çıktı türü
Sinyaller
Veri gereklilikleri
Yalnızca çubuklar
Desteklenen sinyaller
Kesişim

Müşteri değerlendirmeleri

0.0
Değerlendirmeler: 0
Müşteri değerlendirmeleri
Bu ürün için henüz bir değerlendirme yok. Ürünü denediniz mi? O zaman ona dair görüşlerini paylaşan ilk kişi olun!

Tartışma

SSS

EMA
Key Levels
Supply & Demand
ATR
cTrader Store üzerinden erişilebilen işlem botları, göstergeler ve eklentiler gibi ürünler, üçüncü taraf sağlayıcılar tarafından sağlanır ve yalnızca bilgilendirme ve teknik erişim amaçlarıyla sunulur. cTrader Store bir broker değildir ve yatırım tavsiyesi, kişisel öneriler vermez veya gelecekteki performansı garanti etmez.

Bu oluşturanın diğer ürünleri

Gösterge
ATR
CCI
+4
A trend line that never steps back, a shaded band to the price, and a pointer at the swing where the trend turns.
cBot
Balanced
Fixed Lot
+5
Gold grid cBot for XAUUSD H1: four-signal confluence on closed bars, ladders closed at a basket profit, news filter
15.6%
ROI
2.33
Kâr faktörü
Gösterge
ATR
EMA
+3
EMA cross filtered by a trend average and its ATR channel, with long, short and close marks and colored candles.
Gösterge
ADX
ATR
+5
EMA-cross signals scored on six confluence layers, with an ATR stop, three targets and a live panel
Gösterge
ATR
RSI
+5
Fusion trend line with a layered cloud, BULL and BEAR labels, scored re-entry triangles and exit markers.
Gösterge
ATR
RSI
+4
Adaptive Ichimoku with nine-factor confluence scoring, five signal types, smart TP/SL and an MTF panel.
Gösterge
ADX
ATR
+5
SuperTrend signals scored on five confluence factors, with an ATR stop, three targets and a dashboard.
Gösterge
ATR
Volume
+3
Fibonacci trend signals on closed bars, with an ATR stop, up to four targets and a break-even ladder.
Gösterge
ATR
RSI
+4
RSI bands drawn on price, confluence-scored BUY/SELL signals, an ATR stop with three targets
cBot
TP Manager
Break Even
+5
Gold cBot for prop-firm accounts: pick your firm, phase and size; risk is sized from the firm's rules, its limits kept
1.6
Kâr faktörü
Gösterge
ADX
ATR
+5
Ten confluence layers scored on every closed bar, with an anti-chop gate, pivot levels and a live dashboard.
cBot
Channel
Fixed Lot
+5
Gold breakout cBot for XAUUSD M1: H4 high/low channel, RSI veto, one recovery step and a max drawdown close-all
20%
ROI
4.42
Kâr faktörü

Şunları da beğenebilirsiniz

Gösterge
Laguerre RSI: smoother, faster RSI with less noise. Great for spotting reversals and timing entries.
Gösterge
ATR
EMA
+3
EMA trend, RSI reclaim and divergence signals with ATR stop and two targets, swing levels and a 16-row dashboard.
Gösterge
Area of Interest with the power of AI to detect the market interest.
Gösterge
Candle Timer & Strength Panel for cTrader Description: Candle Timer & Strength Panel is an advanced, always-visible over
Gösterge
Forex
EURUSD
+5
With this Fibonacci retracement indicator, traders have full control over the retracement levels displayed on the chart.
Gösterge
Crypto
Signal
+3
Candlestick Signal Finder: cTrader indicator that automatically detects and color-codes key Japanese candlestick pattern
Gösterge
RSI
Stochastic
+2
Composite mean-reversion oscillator merging Z-Score, RSI & Bollinger %B into one clear overbought/oversold signal.
Gösterge
Doji
Volume
+5
Instantly spot high-liquidity institutional moves with clean, non-obtrusive triangle alerts on cTrader charts.
Gösterge
ADX
ATR
+5
Identifies TRENDING, RANGING and VOLATILE markets with pullback detection. Anti-noise filter. Works on ANY chart.
Gösterge
Master RSI reversals with Parabolic SAR precision! Get real-time alerts for high-probability trend changes.
Gösterge
XAUUSD
Commodities
A Fair Value Gap (FVG) indicator that identifies potential price imbalances, potential reversal and continuation zones
Gösterge
ATR
RSI
+1
Super Trend Rsi ,ATR + trend change distance + dynamic Alpha, divergence/convergence
Gösterge
Forex
Multi-timeframe candlesticks!
"MM-Symbol Info (Pro)" logosu
En yüksek puanlı
4.5
(4)
$19
Gösterge
Prop
Forex
NEW - PNLs as % - daily, weekly, monthly, or yearly & Spread, Time To Close, PNL Alerts, custom Bid / Ask lines
Gösterge
Forex
BTCUSD
+12
🎯Automatically identifies the market's significant turning points (key H & L) and draws dynamic support and.....✍️
Gösterge
BOS
CHOCH
+5
A professional-grade cTrader indicator for traders following the Inner Circle Trader (ICT) methodology. It replaces 6–8
Gösterge
SMC
Prop
+7
institutional-level market analysis
Gösterge
Forex
Identify 34 candlestick patterns, track trends across timeframes, and get instant alerts with this powerful trading tool

Fiyat

12
Satışlar
216
Ücretsiz yüklemeler