present
ลงทะเบียนและรับส่วนลด $50 สำหรับการซื้อครั้งแรกของคุณ
Trading product for Corex Smart Bear Bull อินดิเคเตอร์ Key Levels RSI, image 1
Corex Smart Bear Bull
อินดิเคเตอร์
110 ดาวน์โหลด
เวอร์ชัน 1.0, Sep 2026
Windows, Mac
5.0
รีวิว: 2
Trading product for Corex Smart Bear Bull อินดิเคเตอร์ Key Levels RSI, image 2
Trading product for Corex Smart Bear Bull อินดิเคเตอร์ Key Levels RSI, image 3
Trading product for Corex Smart Bear Bull อินดิเคเตอร์ Key Levels RSI, image 4
Trading product for Corex Smart Bear Bull อินดิเคเตอร์ Key Levels RSI, image 5
Trading product for Corex Smart Bear Bull อินดิเคเตอร์ Key Levels RSI, image 6
Trading product for Corex Smart Bear Bull อินดิเคเตอร์ Key Levels RSI, image 7
Trading product for Corex Smart Bear Bull อินดิเคเตอร์ Key Levels RSI, image 8
Trading product for Corex Smart Bear Bull อินดิเคเตอร์ Key Levels RSI, image 9
Trading product for Corex Smart Bear Bull อินดิเคเตอร์ Key Levels RSI, image 10
Trading product for Corex Smart Bear Bull อินดิเคเตอร์ Key Levels RSI, image 11
16
การขาย
340
ติดตั้งฟรี

คำอธิบาย

Corex Smart Bear Bull อ่านแนวโน้มในสองชั้น: เส้นฟิวชันสำหรับทิศทาง และเครื่องยนต์ Williams %R สำหรับช่วงเวลาที่จะดำเนินการภายในนั้น


เส้นฟิวชัน


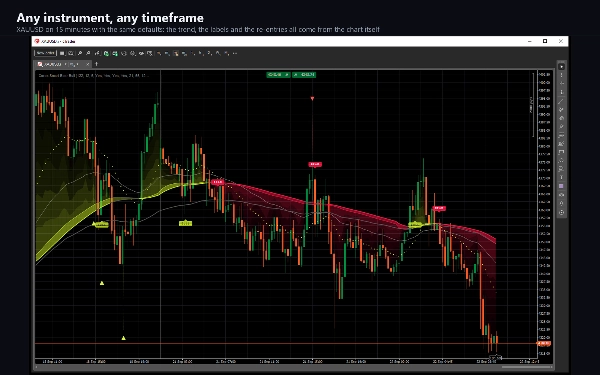
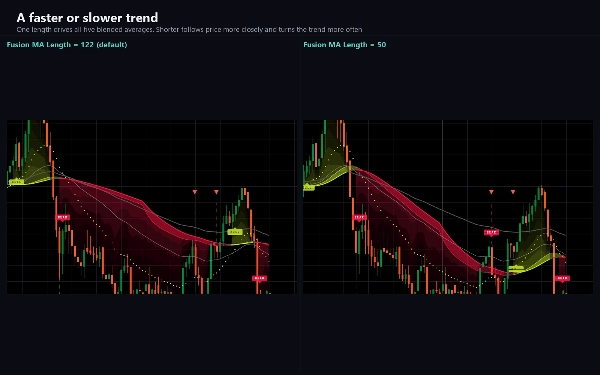
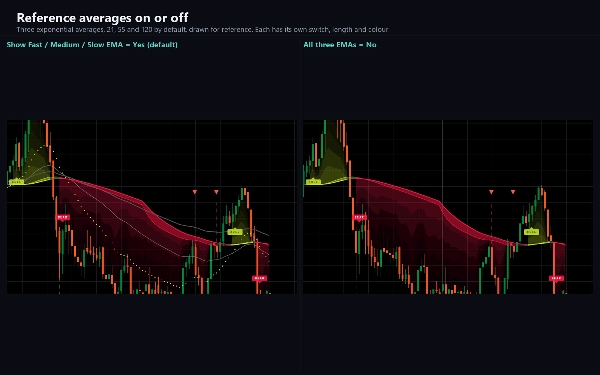
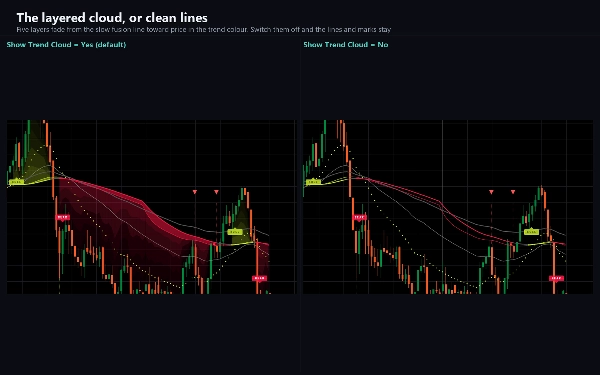
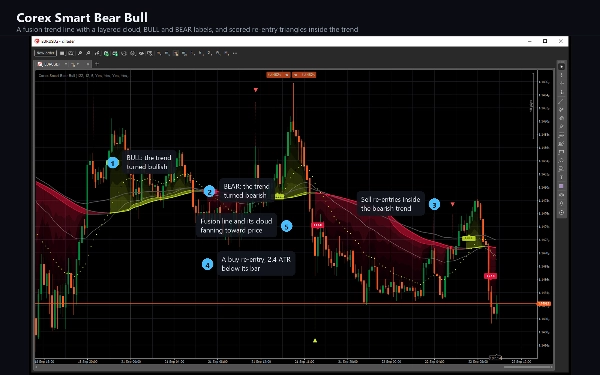
ค่าเฉลี่ยเคลื่อนที่ห้าค่าในความยาวเดียวกัน - แบบเลขชี้กำลัง, แบบง่าย, แบบถ่วงน้ำหนัก, Arnaud Legoux และ VWAP ของช่วงเวลา - ถูกผสมรวมเป็นหนึ่งและทำให้เรียบเป็นเส้นช้าและเส้นเร็ว ตลาดเป็นขาขึ้นเมื่อราคาปิดเหนือเส้นช้าที่กำลังขึ้น, เป็นขาลงเมื่อราคาปิดต่ำกว่าเส้นที่กำลังลง และเป็นกลางในกรณีอื่น ๆ; ทั้งสองเส้นจะมีสีของสถานะนั้น ก้อนเมฆชั้นซ้อนกันแผ่ออกจากเส้นช้าไปยังราคาในสีแนวโน้ม ค่อย ๆ จางลงทีละชั้น และแถบระหว่างเส้นช้าและเส้นเร็วแสดงว่าเส้นใดนำหน้า


ป้ายแนวโน้ม


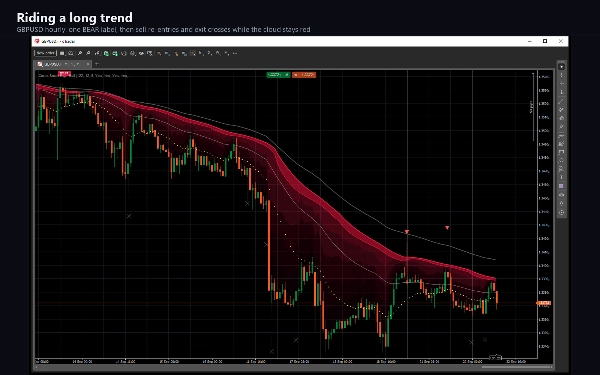
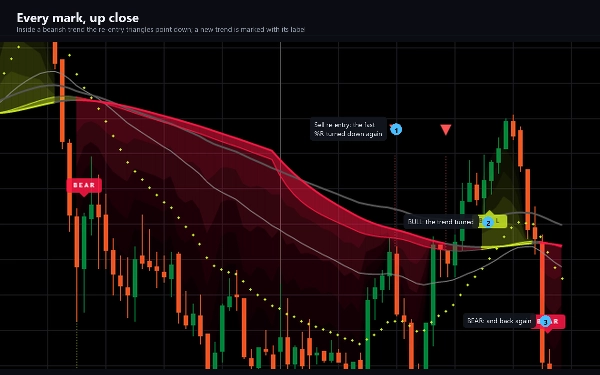
ป้าย BULL ปรากฏใต้แท่งที่ตลาดเปลี่ยนเป็นขาขึ้น และป้าย BEAR อยู่เหนือแท่งที่ตลาดเปลี่ยนเป็นขาลง การเย็นตัวจะเก็บป้ายสองป้ายในทิศทางเดียวกันให้ห่างกันตามจำนวนแท่งที่กำหนด


สามเหลี่ยมเข้าใหม่และการออก


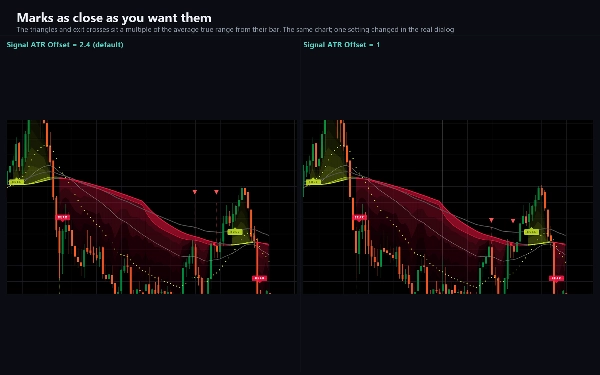
ในขณะที่ตลาดเป็นขาขึ้น สามเหลี่ยมสีเขียวมะนาวใต้แท่งบ่งชี้การซื้อเข้าใหม่; ในขณะที่ตลาดเป็นขาลง สามเหลี่ยมสีแดงเหนือแท่งบ่งชี้การขายเข้าใหม่ พวกมันมาจากเครื่องยนต์ Williams %R ที่มีสามช่วงเวลา: เส้นเร็วที่ตัดออกจากโซนขายเกินหรือซื้อมากเกินไปจะกระตุ้นผู้สมัคร และมีการรับรู้ทริกเกอร์ห้าประเภท - การกระตุกจากจุดสุดขีด, การหมดแรง, การต่อเนื่อง, การดึงกลับ และทั้งสามเส้นยืดออกพร้อมกัน ผู้สมัครแต่ละคนจะได้รับคะแนนจาก 0 ถึง 100 จากการอ่าน ความเร็วของการเคลื่อนไหว ช่วงเวลาการซื้อขาย ตำแหน่งเทียบกับค่าเฉลี่ย 50 และ 200 RSI และปริมาณ; ทริกเกอร์หลายตัวในแท่งเดียวกันจะเพิ่มโบนัส และคะแนนขั้นต่ำจะกรองผู้สมัครที่อ่อนแอ ประตูแนวโน้มจะบล็อกผู้สมัครที่สวนทางแนวโน้มในขณะที่เส้นช้ากว่าแสดงแนวโน้มที่แข็งแกร่ง เว้นแต่เส้นเร็วจะฟื้นตัวจากจุดสุดขีดแล้ว หลังจากเข้าใหม่ สัญญาณตรงกันข้ามแรกภายในแนวโน้มจะบ่งชี้การออกด้วยเครื่องหมายกากบาทสีเทา เครื่องหมายแต่ละอันอยู่ห่างจากแท่งเป็นจำนวนเท่าของช่วงจริงเฉลี่ย และเชื่อมต่อกับแท่งด้วยเส้นประ


การตั้งค่า


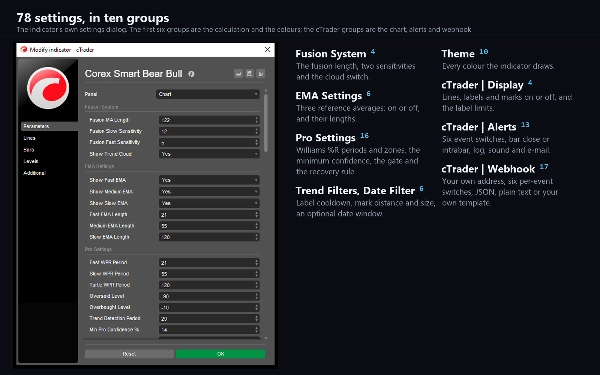
ความยาวฟิวชันและความไวสองระดับ, ค่าเฉลี่ยอ้างอิงสามค่า, ช่วงเวลาของ Williams %R สามช่วงและโซนของพวกมัน, ความมั่นใจขั้นต่ำ, ประตูและระดับของมัน, กฎการฟื้นตัว, การเย็นตัวของป้าย, ระยะห่างและขนาดของเครื่องหมาย, หน้าต่างวันที่เลือกได้ และสีสิบสี องค์ประกอบการวาดแต่ละอย่างมีสวิตช์ของตัวเอง และการปิดสวิตช์หนึ่งจะเปลี่ยนแค่การวาดเท่านั้น: ค่าต่าง ๆ การแจ้งเตือน และ webhook จะยังคงทำงานต่อไป


การแจ้งเตือนและ webhook


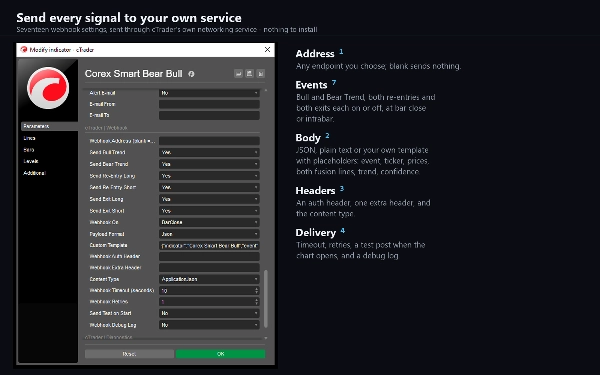
เหตุการณ์หกประเภท: แนวโน้มขาขึ้น, แนวโน้มขาลง, เข้าใหม่แบบยาว, เข้าใหม่แบบสั้น, ออกแบบยาว และออกแบบสั้น แต่ละเหตุการณ์มีสวิตช์ของตัวเองและสามารถส่งสัญญาณเมื่อแท่งปิดหรือทันทีที่เงื่อนไขเป็นจริง การส่งมอบเป็นบรรทัดบันทึก, เสียง หรืออีเมล นอกจากนี้ยังมี webhook: ป้อนที่อยู่และแต่ละเหตุการณ์จะถูกโพสต์ไปยังที่อยู่นั้นในรูปแบบ JSON, ข้อความธรรมดา หรือในเทมเพลตที่คุณเขียนเองพร้อมตัวแทนสำหรับสัญลักษณ์, กรอบเวลา, เวลา, ราคา, เส้นฟิวชันทั้งสอง, แนวโน้ม และคะแนนความมั่นใจทั้งสอง มันจะปิดจนกว่าคุณจะป้อนที่อยู่, จะไม่ส่งอะไรในช่วงประวัติหรือการทดสอบย้อนหลัง และไม่ต้องการสิทธิ์พิเศษ - การโพสต์จะส่งผ่านบริการเครือข่ายของ cTrader เอง


สำหรับ cBOTS


ซีรีส์ผลลัพธ์สิบสี่ชุด: เส้นฟิวชันทั้งสอง, ค่าเฉลี่ยสามค่า, แนวโน้ม, คะแนนความมั่นใจทั้งสอง และซีรีส์หนึ่งชุดต่อเหตุการณ์แต่ละประเภท


ประเภทและหน้าต่าง


ตัวบ่งชี้แนวโน้มพร้อมสัญญาณ วาดบนแผนภูมิราคา


กรอบเวลาและเครื่องมือ


กรอบเวลาที่อิงตามเวลาใดก็ได้; ค่าเริ่มต้นอ่านได้ดีตั้งแต่ M5 ถึง H4 ใช้งานได้กับเครื่องมือใดก็ได้ - คู่ฟอเร็กซ์, โลหะ, ดัชนี และคริปโต VWAP ของช่วงเวลาและตัวกรองปริมาณใช้ปริมาณติ๊กของโบรกเกอร์ และวันช่วงเวลาการซื้อขายเริ่มต้นที่ 17:00 ตามเวลานิวยอร์ก


สำหรับใคร


เทรดเดอร์ที่ติดตามแนวโน้มและต้องการช่วงเวลาที่ถูกทำเครื่องหมายและให้คะแนนเพื่อเข้าร่วมหรือหลีกเลี่ยง พร้อมการแจ้งเตือนในแต่ละช่วงเวลา


หมายเหตุ


เครื่องหมายติดตามแท่งที่ยังอยู่ในระหว่างการก่อตัว ดังนั้นเครื่องหมายหนึ่งอาจปรากฏและหายไปจนกว่าแท่งนั้นจะปิด การแจ้งเตือนและโพสต์ webhook ตั้งค่าเริ่มต้นที่การปิดแท่ง ซึ่งเป็นจุดที่เงื่อนไขเป็นที่สิ้นสุด แผนภูมิจะเก็บป้ายล่าสุด 500 ป้ายและเส้นเชื่อมต่อ 50 เส้น; สวิตช์แสดงผลจะเก็บทั้งหมดไว้


การซื้อขายมีความเสี่ยง ผลการดำเนินงานในอดีตไม่รับประกันผลลัพธ์ในอนาคต

สรุป

สรุปโดย AI
Corex Smart Bear Bull is a trend indicator designed for use on price charts across any time-based timeframe, with optimal readability from M5 to H4. It supports various instruments including forex pairs, metals, indices, and cryptocurrencies. The indicator combines five moving averages—exponential, simple, weighted, Arnaud Legoux, and session VWAP—into a fusion line, which is smoothed into slow and fast lines to determine market direction: bullish, bearish, or neutral. A layered cloud visually represents the trend strength and direction.

The indicator features BULL and BEAR labels marking trend reversals, with a cooldown period to space labels. It uses a Williams %R engine with three periods to identify scored re-entry points via colored triangles (lime for buy, red for sell) and exit markers (gray crosses). These signals are scored based on multiple factors including momentum, session, position relative to moving averages, RSI, and volume. A trend gate filters counter-trend signals during strong trends.

Settings allow customization of fusion length, sensitivities, reference averages, Williams %R parameters, confidence thresholds, label cooldown, and visual elements. Alerts and webhook notifications are available for six event types, delivering data via log, sound, email, or customizable JSON posts. The indicator outputs multiple data series for integration with cBots.
โปรไฟล์อินดิเคเตอร์
หมวดหมู่อินดิเคเตอร์
Trend
ประเภทเอาต์พุต
การแสดงเป็นภาพ
สัญญาณ
ข้อกำหนดด้านข้อมูล
ปริมาณ
สัญญาณที่รองรับ
Cross
Reversal
ความแข็งแกร่งของแนวโน้ม

การสนทนา

รีวิวจากลูกค้า

5.0
รีวิว: 2
5
100 %
4
0 %
3
0 %
2
0 %
1
0 %
รีวิวจากลูกค้า
October 26, 2026
five averages for the trend and 3 Williams %R periods for reentries give this a properly layered approach. Session and momentum context make the scoring more informative than a bare BULL or BEAR label. The score remains the tool's own assessment, not a promised win probability.
October 11, 2026
Corex Smart Bear Bull combines trend context, BULL/BEAR transitions, re-entry triangles and exit marks in one structured overlay. Testing on EURUSD and XAUUSD across H1 and M1 showed consistent rendering and clear trend behavior. The full layout can become visually dense, but individual layers are configurable.

คำถามที่พบบ่อย

Key Levels
RSI
Volume
ATR
Triangle
Moving Average
VWAP
ผลิตภัณฑ์ที่มีให้บริการผ่าน cTrader Store รวมถึงบอทการเทรด อินดิเคเตอร์ และปลั๊กอิน มีให้บริการโดยนักพัฒนาบุคคลที่สามและมีไว้เพื่อวัตถุประสงค์ในการเข้าถึงข้อมูลและทางเทคนิคเท่านั้น cTrader Store ไม่ใช่โบรกเกอร์และไม่ได้ให้คำแนะนำการลงทุน คำแนะนำส่วนบุคคล หรือการรับประกันผลการดำเนินงานในอนาคต

เพิ่มเติมจากผู้เขียนคนนี้

อินดิเคเตอร์
ATR
CCI
+4
A trend line that never steps back, a shaded band to the price, and a pointer at the swing where the trend turns.
"Bullion Horizon" โลโก้
สถิติสด
5.0
(2)
$97
/
$147
cBot
Balanced
Fixed Lot
+5
Gold grid cBot for XAUUSD H1: four-signal confluence on closed bars, ladders closed at a basket profit, news filter
15.6%
ROI
2.33
อัตราส่วน กำไรต่อขาดทุน
อินดิเคเตอร์
ATR
EMA
+3
EMA cross filtered by a trend average and its ATR channel, with long, short and close marks and colored candles.
"Reverse RSI Phantom" โลโก้
เรตติ้งสูง
4.5
(4)
$29
/
$47
อินดิเคเตอร์
ATR
RSI
+4
RSI bands drawn on price, confluence-scored BUY/SELL signals, an ATR stop with three targets
"Sniper Ashfield Pro" โลโก้
เรตติ้งสูง
4.4
(5)
$29
/
$47
อินดิเคเตอร์
ADX
ATR
+5
EMA-cross signals scored on six confluence layers, with an ATR stop, three targets and a live panel
อินดิเคเตอร์
ATR
RSI
+4
Adaptive Ichimoku with nine-factor confluence scoring, five signal types, smart TP/SL and an MTF panel.
อินดิเคเตอร์
ADX
ATR
+5
SuperTrend signals scored on five confluence factors, with an ATR stop, three targets and a dashboard.
อินดิเคเตอร์
ATR
EMA
+4
Range-filter BUY/SELL signals scored by four confluence layers, with a stop, five targets and a trend panel
อินดิเคเตอร์
ATR
Volume
+3
Fibonacci trend signals on closed bars, with an ATR stop, up to four targets and a break-even ladder.
"QuotientDrift" โลโก้
สถิติสด
5.0
(1)
$97
/
$147
cBot
TP Manager
Break Even
+5
Gold cBot for prop-firm accounts: pick your firm, phase and size; risk is sized from the firm's rules, its limits kept
1.6
อัตราส่วน กำไรต่อขาดทุน
"Supply Demand Quadra Zones" โลโก้
เรตติ้งสูง
5.0
(4)
$29
/
$47
อินดิเคเตอร์
ATR
EMA
+2
Eight-EMA ribbon with ATR trade zones, a nine-symbol screener and a five-timeframe trend dashboard.
อินดิเคเตอร์
ADX
ATR
+5
Ten confluence layers scored on every closed bar, with an anti-chop gate, pivot levels and a live dashboard.

นอกจากนี้คุณยังอาจชอบ

"VWAP_" โลโก้
ยอดนิยม
4.6
(3)
$25
/
$38
อินดิเคเตอร์
VWAP
Forex
+5
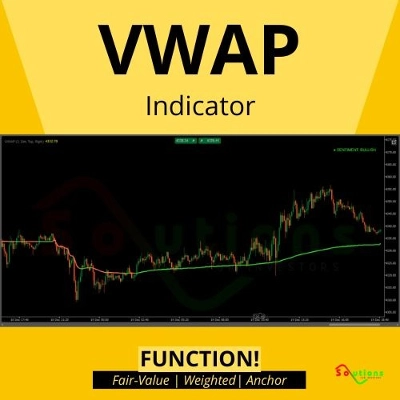
Trade with institutional accuracy. Identify fair price levels and high-volume zones instantly!
"QX TradeDecision" โลโก้
เรตติ้งสูง
4.5
(4)
$20
/
$22
อินดิเคเตอร์
ATR
Flag
+5
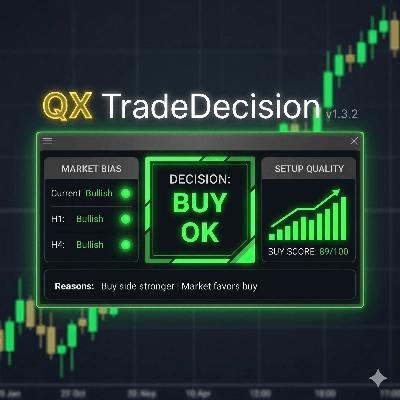
Decision panel with Buy/Sell scores, market bias, setup quality, trading cost and clear trade reasons.
อินดิเคเตอร์
Forex
Crypto
+5
Experience a new approach with amplitude-based momentum analysis. Smart Trend Detection That Adapts to Market Volatility
อินดิเคเตอร์
RSI
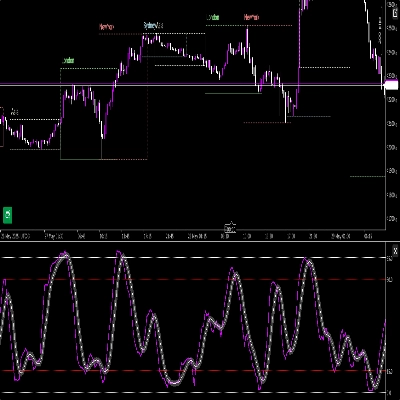
Indicator Stochastic With RSI
อินดิเคเตอร์
VWAP
Support & Resistance
Trading.FC$_vwap Algo shows VWAP trends, dynamic support/resistance and deviation bands to spot potential trade entries.
อินดิเคเตอร์
Supertrend
Moving Average
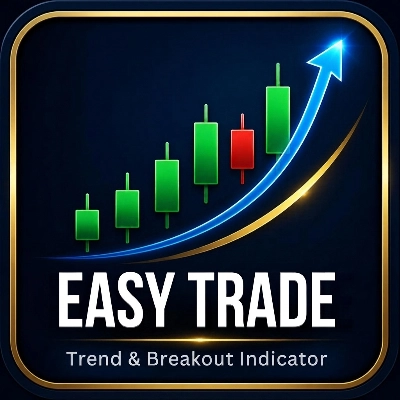
Easy Trade: Trend & Breakout Indicator for cTrader
"ADXMultiframeIndicator" โลโก้
เรตติ้งสูง
4.7
(4)
$19
/
$29
อินดิเคเตอร์
Indices
Multi-Timeframe ADX Trend Dots & Arrows
"RangePulsePro" โลโก้
ใหม่
5.0
(1)
$35
อินดิเคเตอร์
Risk Dashboard
AI-powered daily range forecasts help traders spot volatility opportunities and plan stops and targets.
"Axiom Matrix" โลโก้
ใหม่
4.6
(3)
$39
อินดิเคเตอร์
Volume
Support & Resistance
Compare up to 27 symbols across eight timeframes with seven analysis engines and an interactive cTrader dashboard.
อินดิเคเตอร์
Project market behavior by integrating price and volume data across multiple time dimensions
"AutoAVWAP" โลโก้
เรตติ้งสูง
4.5
(4)
$19
/
$25
อินดิเคเตอร์
Prop
VWAP
+11
The best automatic anchored VWAP indicator every trader can get help from.
อินดิเคเตอร์
Prop
Forex
+11
🌊 See when the market is truly in play. Tsunami measures Relative Volume by time-of-day 🌊
อินดิเคเตอร์
BOS
EMA
+5
Market structure signals graded A to C, each with a drawn trade plan, plus an adaptive trend ribbon and a trend matrix
อินดิเคเตอร์
SMA
Market Structure
ICT Power of 3 AMD
"Follow Line" โลโก้
เรตติ้งสูง
4.5
(6)
ฟรี
อินดิเคเตอร์
ATR
MACD
+5
The Follow Line Indicator is a versatile tool designed to identify market trends and provide accurate buy/sell signals.
อินดิเคเตอร์
Market Structure
Stop guessing which trading session you in, with Sessions indicator sessions are in your finger tips like a pro
"Market Sentiment Pro" โลโก้
ยอดนิยม
3.6
(3)
$19
อินดิเคเตอร์
Forex
BTCUSD
+9
Market Sentiment Pro: Predict tops & bottoms using crowd psychology. Contrarian signals with 70-80% accuracy. Early Acce
อินดิเคเตอร์
BOS
CHOCH
+5
A professional-grade cTrader indicator for traders following the Inner Circle Trader (ICT) methodology. It replaces 6–8

ราคา

16
การขาย
340
ติดตั้งฟรี